Projects / Horizon

Predict before
the complaint arrives.

An AI-assisted operations console that tells telecom support teams what’s about to break, who it will hit and what to do next, before a single customer calls.

Role
Solo · end to end
Timeline
1 week · November 2025
Type
Personal project
I did
Research · Systems · AI/UX · UI · Prototype
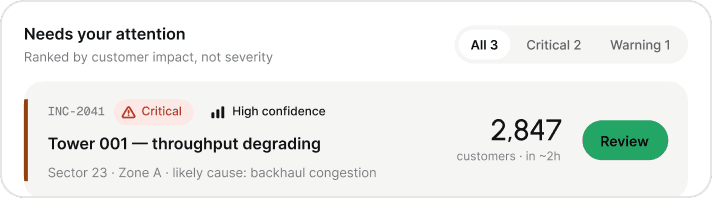
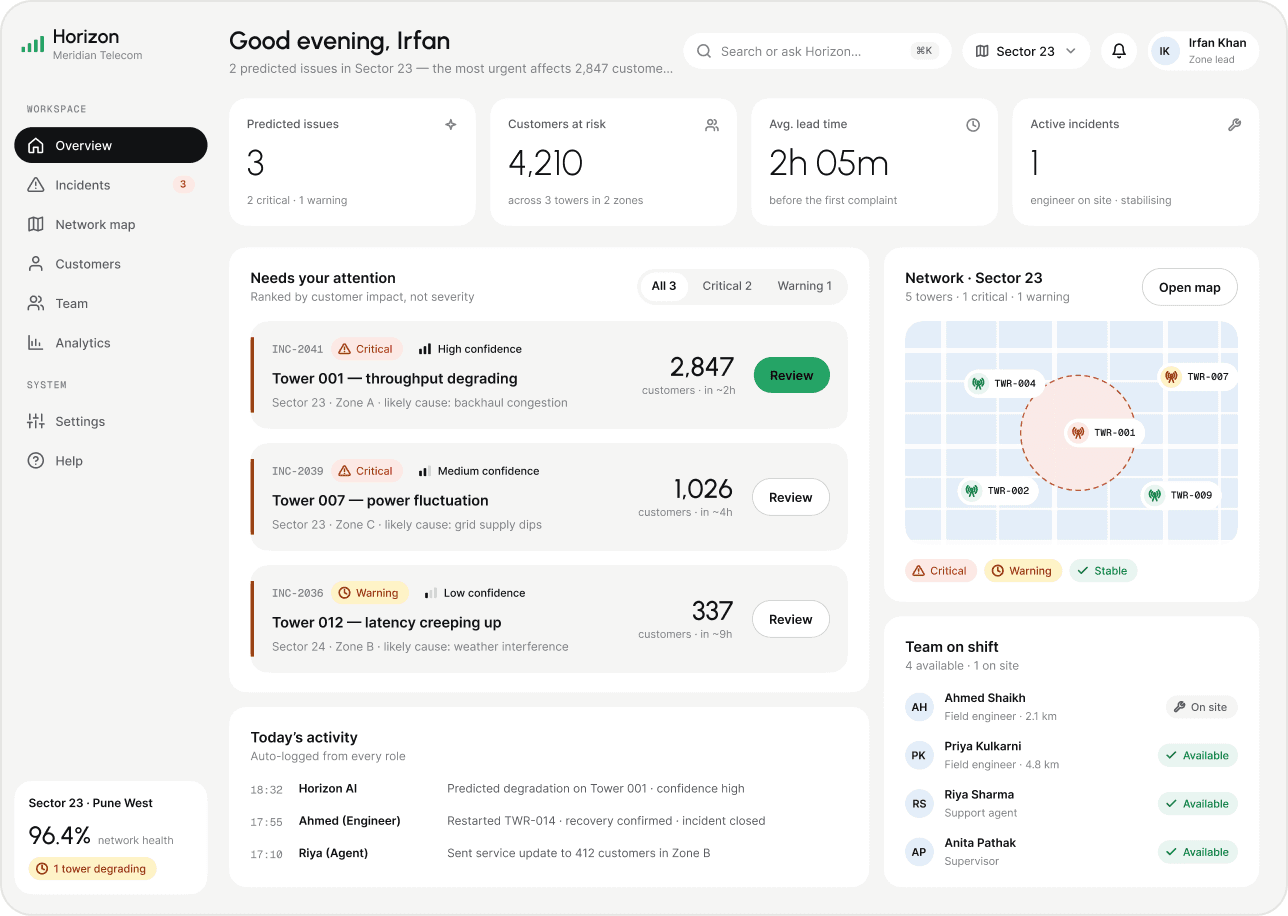
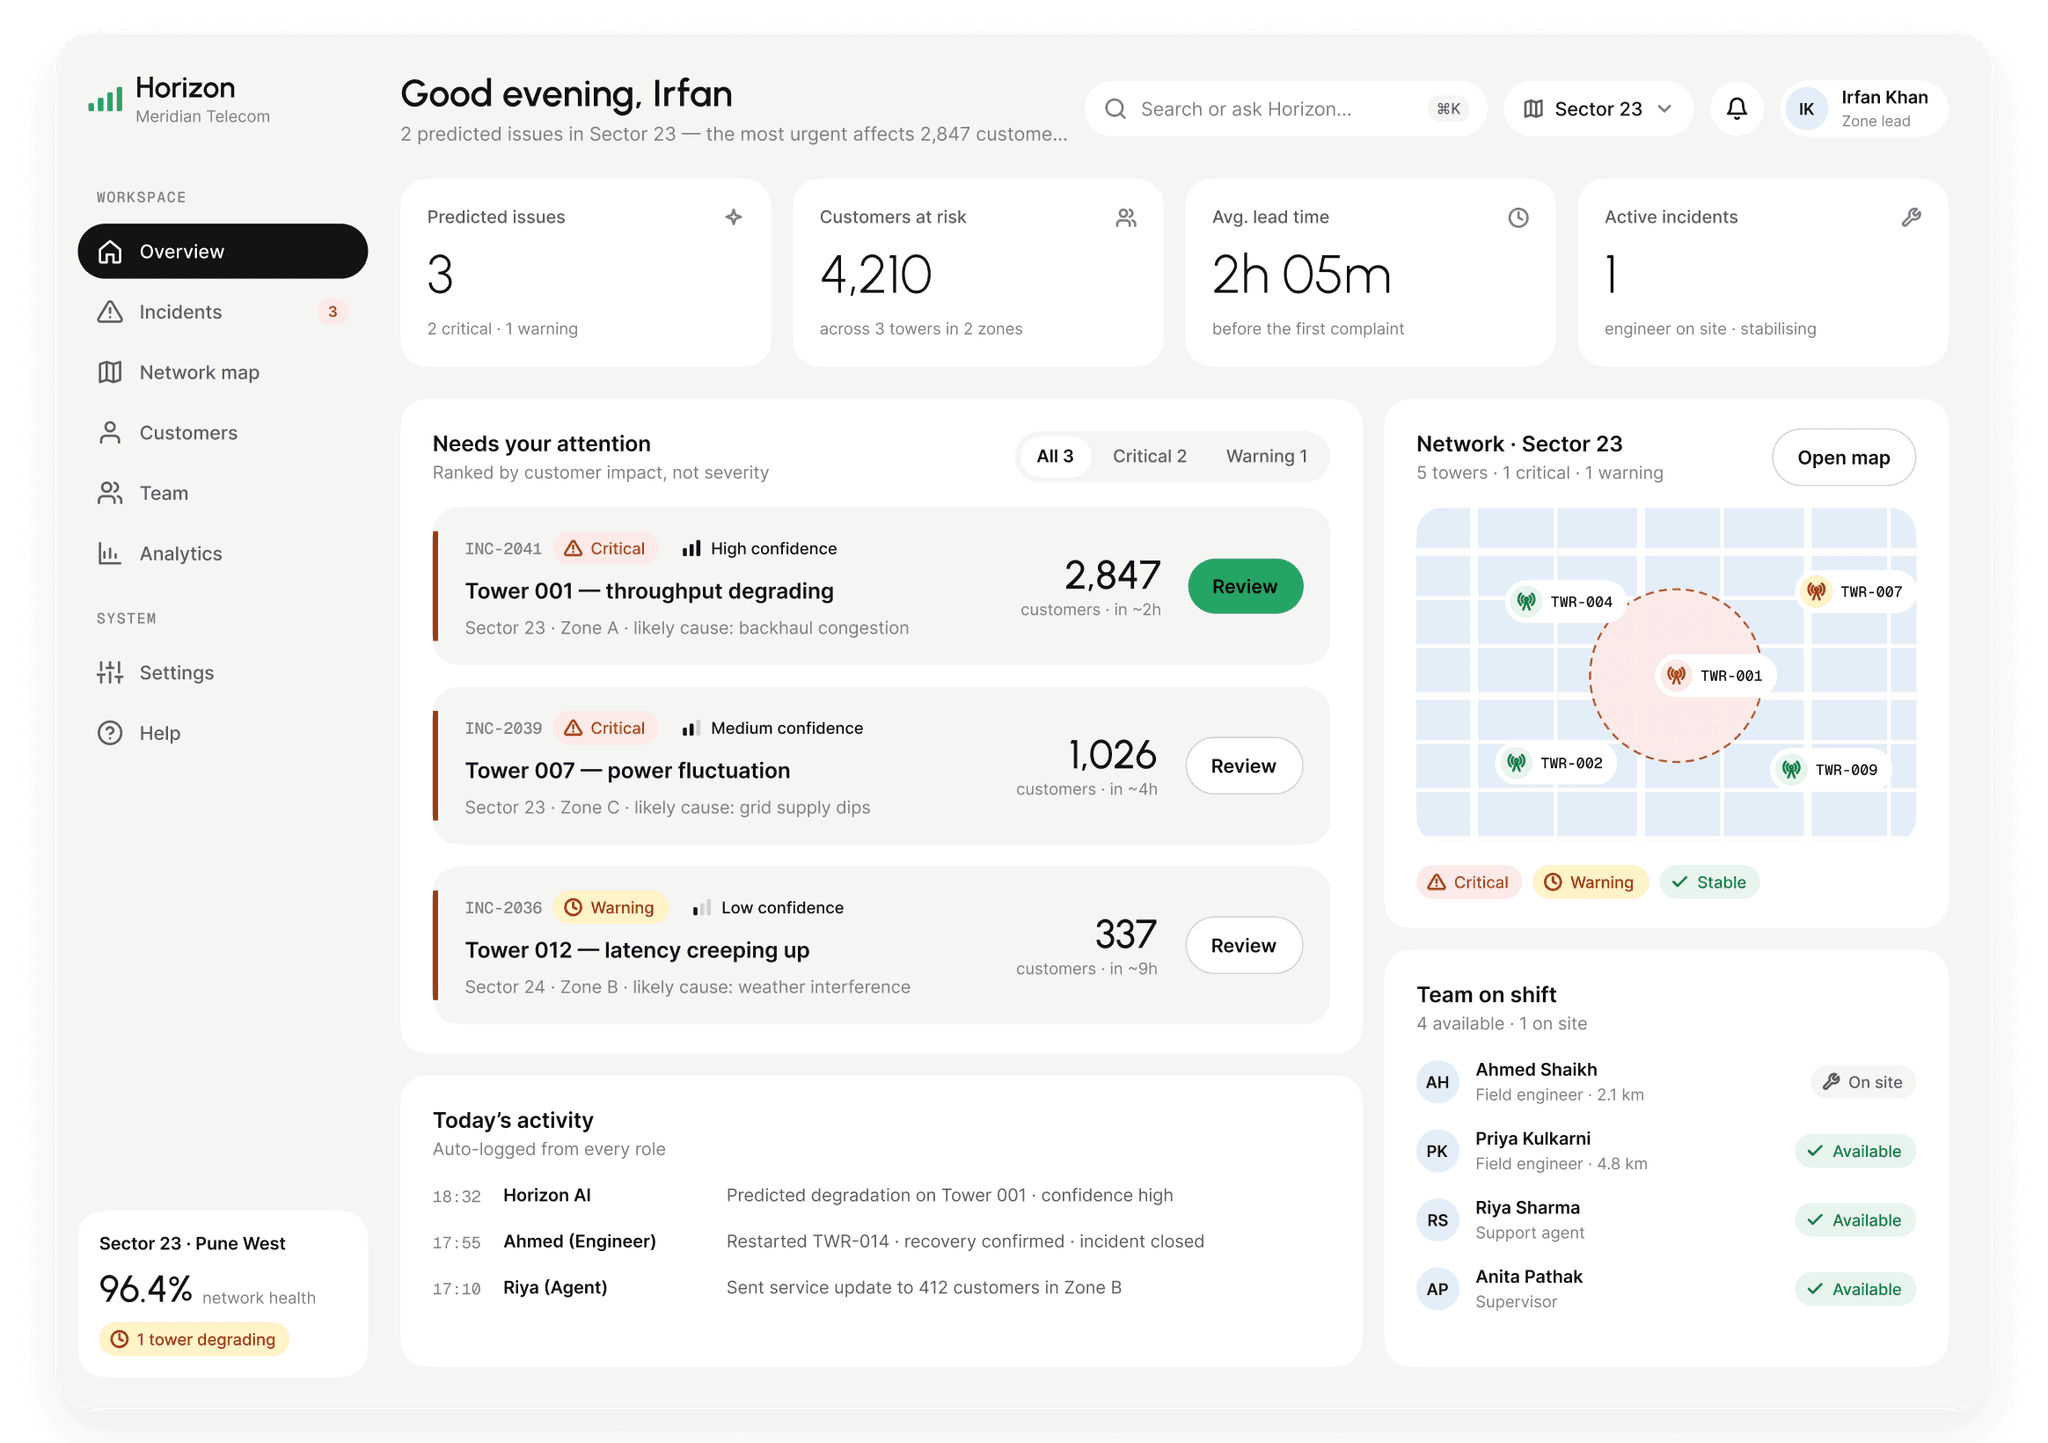
Horizon overview screen: the zone lead’s console with predicted issues ranked by customers affected
In 30 seconds

Horizon, on one screen

01 · Problem

Support learns about outages from angry customers, hours after the network showed signs.

02 · Insight

The signals already exist. They reach the wrong role, too late, in a language nobody can act on.

03 · Solution

One shared incident that explains the cause, counts the customers at risk and suggests the next step.

01Context & problem

Towers fail in clusters, silently. Support finds out last.

6:40 pm. Tower 001, Sector 23.

Uptime 87% and falling. 2,847 people connected.

None of them have called yet.

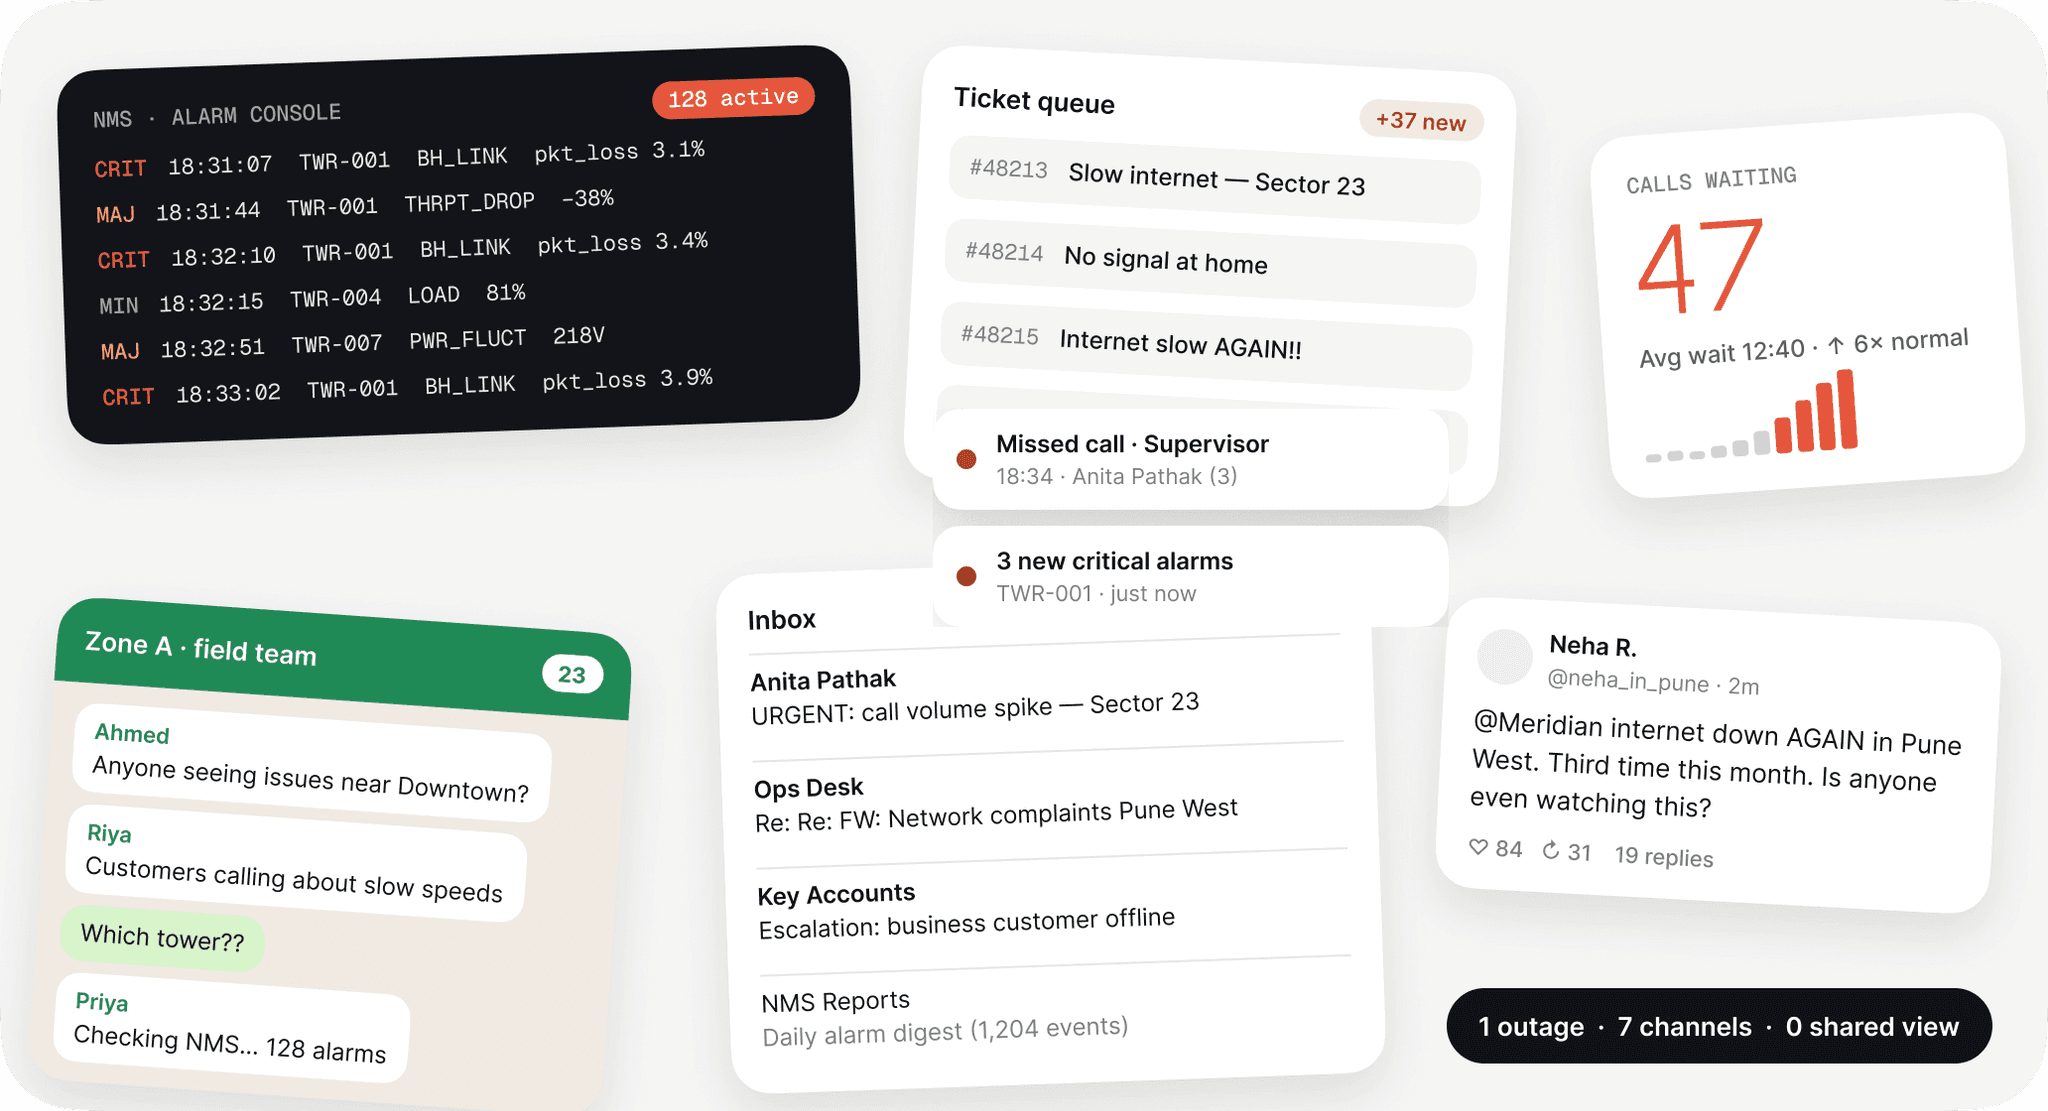
Networks run as Region → Sector → Zone → Tower. When one tower degrades, a whole cluster of customers drops at once, and the signs are scattered across 7 channels nobody sees together.

Collage of seven scattered channels: alarm console, tickets, chat, dashboards and calls about the same outage
The same outage, as support sees it today.
Problem statement

Telecom support teams can’t see a network problem until customers complain, and even when early signals exist, no single role can turn them into coordinated action.

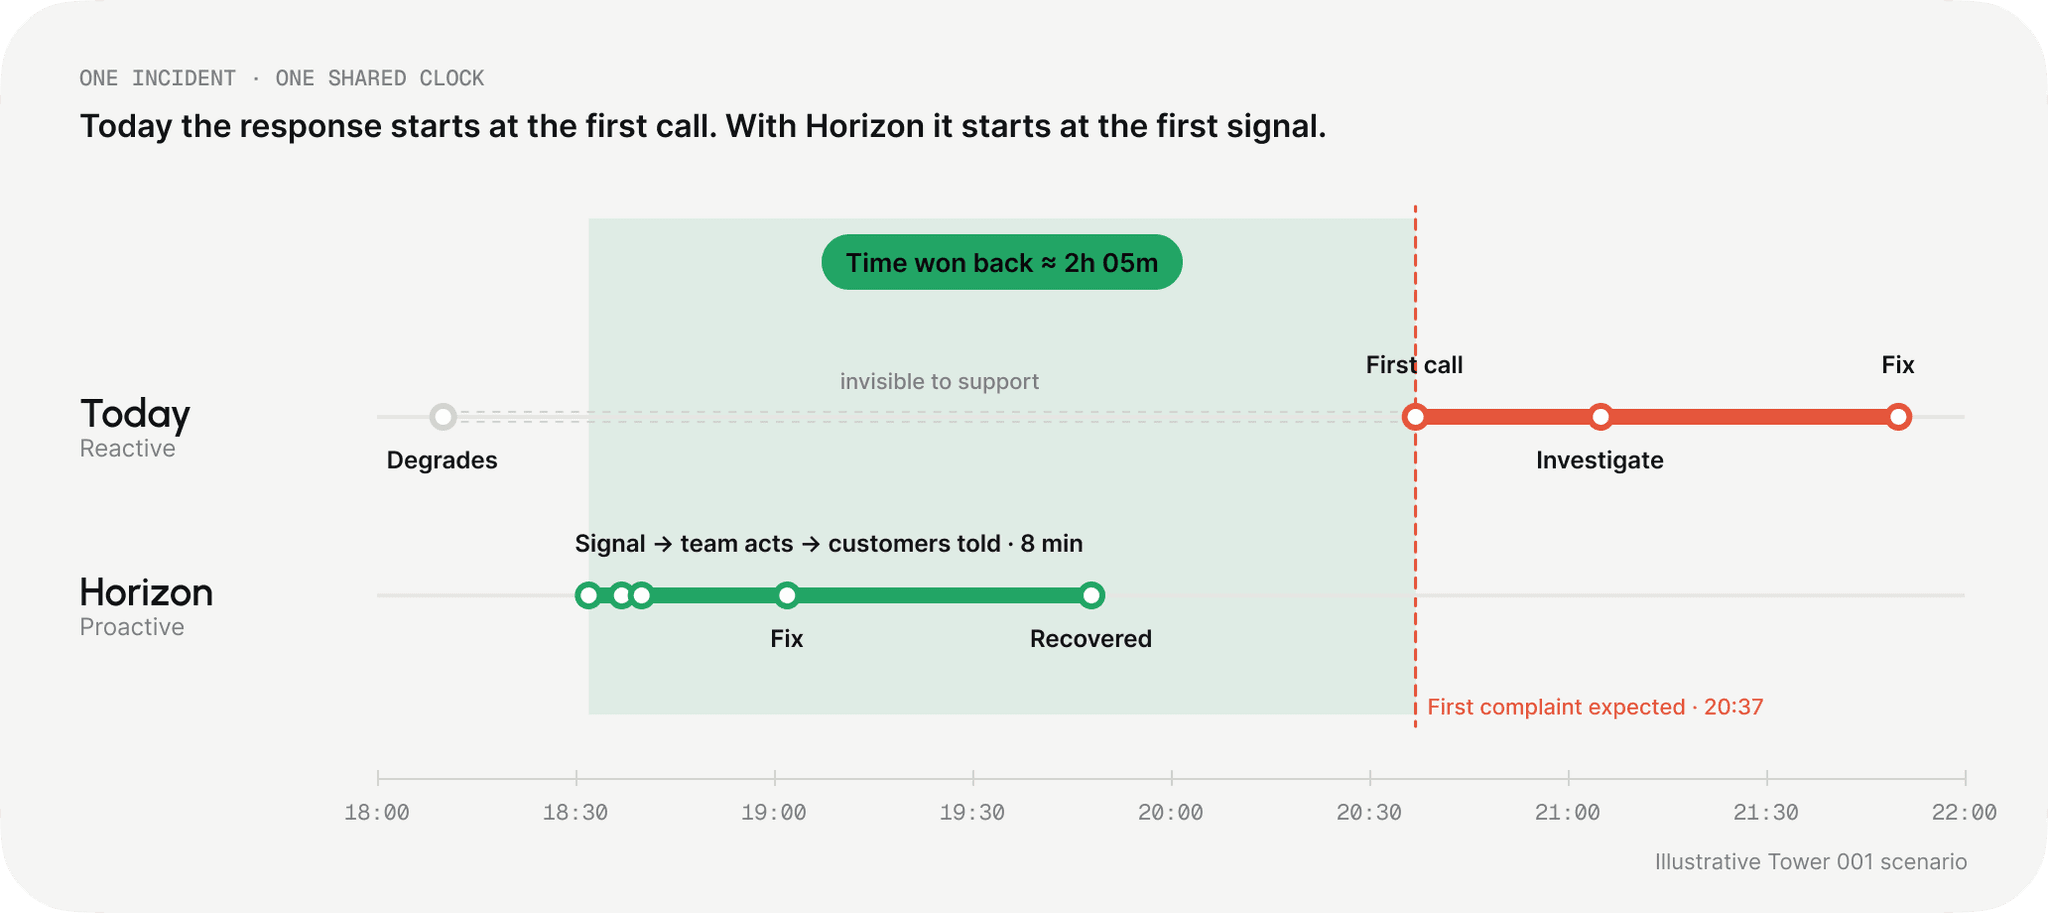
Timeline: today the response starts at the first call; with Horizon it starts at the first signal, about 2 hours earlier
The opportunity: start the response at the first signal, not the first call, about 2 hours earlier in the Tower 001 scenario.
02Research

Every signal already exists. It just lands with the wrong person, too late.

Three questions I set out to answer

  1. 1

    How do support teams find out about network issues today?

  2. 2

    What does each role need to act before complaints escalate?

  3. 3

    How should a prediction be explained so non-engineers trust it?

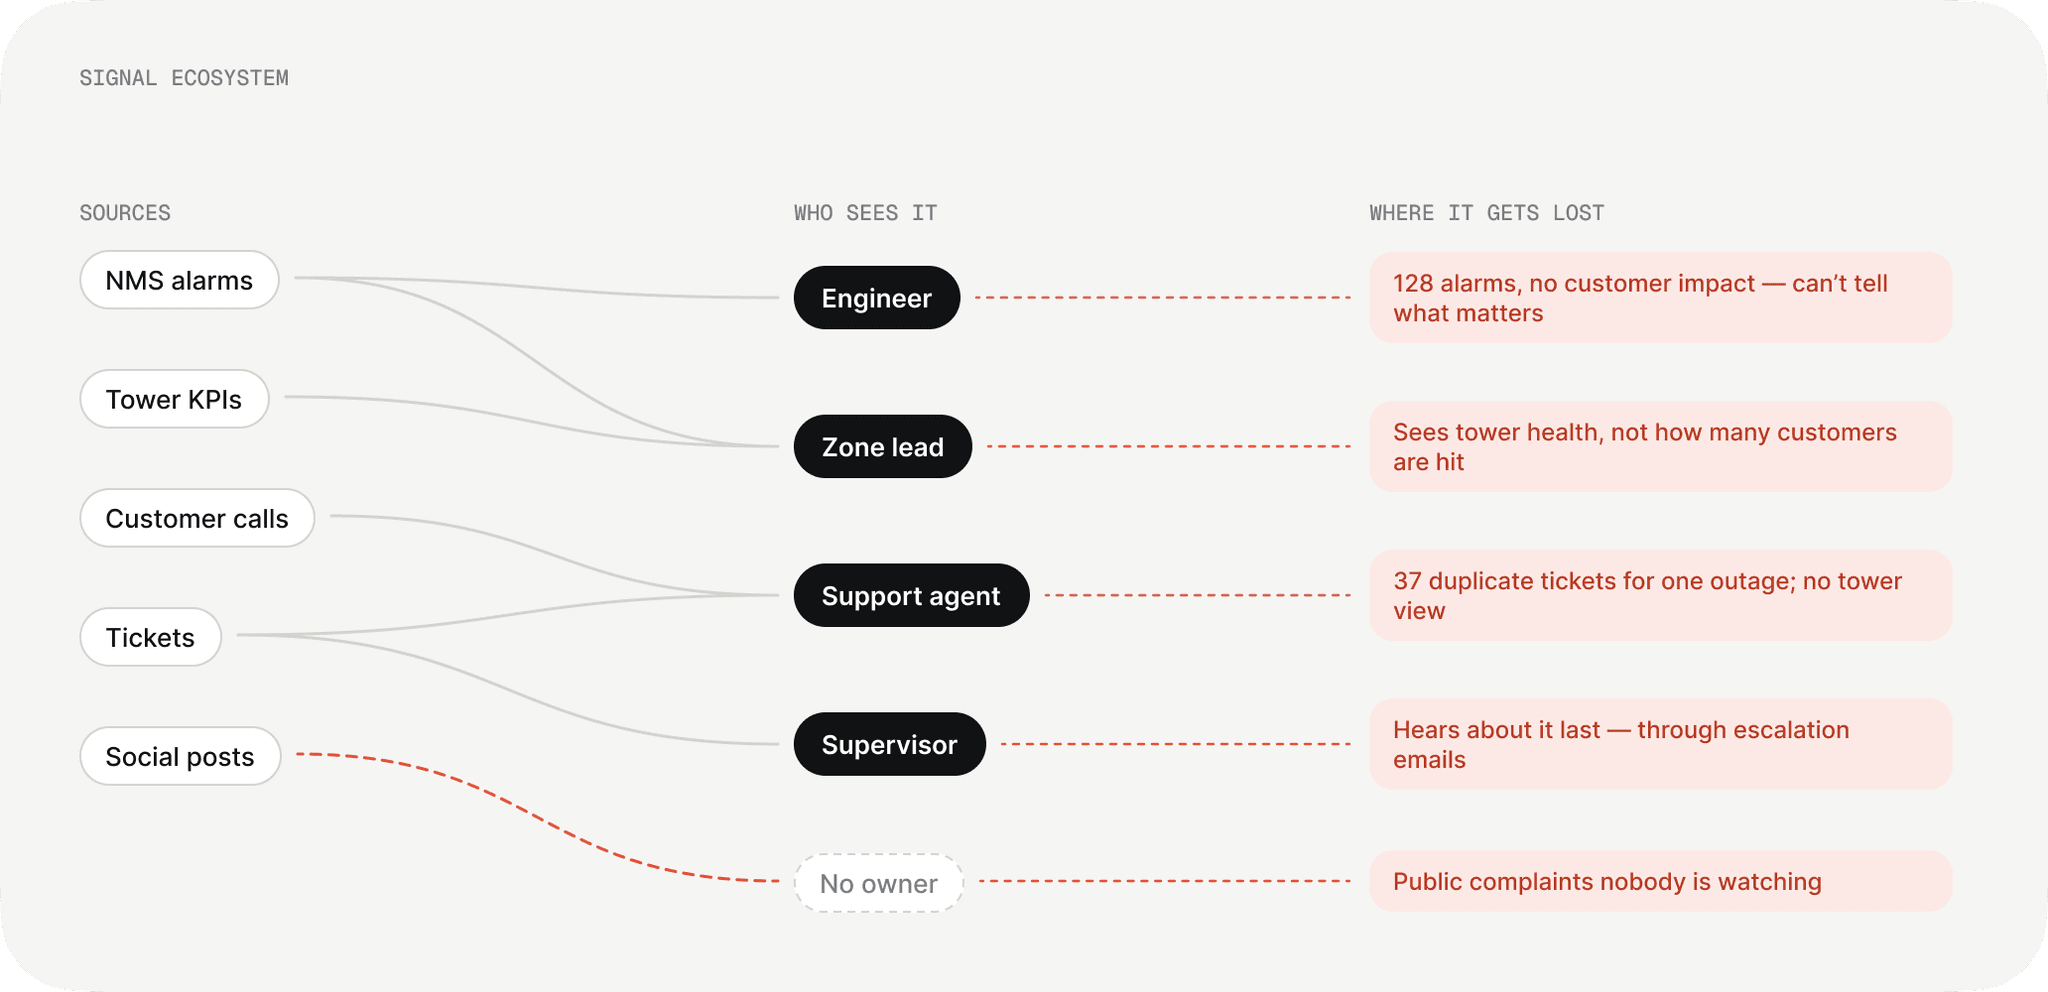
Map of who sees each signal and where it gets lost
Who sees each signal, and where it gets lost. Engineers see alarms but not customers; agents see customers but not the network.
Desk research

Six sources, one pattern.

Rising network complexity makes early detection hard

Networks now span 5G, fibre, VoLTE/VoWiFi and many devices, so support teams struggle to spot issues before customers complain.

Source · Ericsson
Proactive monitoring cuts downtime and support load

Predictive analytics plus automated anomaly detection can reduce MTTR by up to 43%.

Source · IEEE Xplore
Telecom problems come in clusters

Networks run as Region → Sector → Zone/Tower, and issues usually hit a whole cluster, not one user.

Source · ITU Telecom
Reactive maintenance raises cost and risk

Fixing after failure leads to high operating costs and frequent service disruptions.

Source · IAEME
Early detection + automation lower repair effort

Proactive fault detection and automated maintenance reduce unexpected downtime and repair overhead.

Source · Sutherland
Predictive maintenance improves reliability

AI/ML analytics keep equipment healthy, cutting downtime and making service more reliable.

Source · CelerData
The pattern

Outages hit whole clusters, and catching them early is cheaper, so Horizon works per tower and counts customers, not tickets.

Insights

4 insights that shaped the product

Insight 01A prediction is useless without a next step.

Alerts are accurate, but agents still interpret them by hand.

→ Issue cards: cause + next action
Insight 02Severity isn’t priority. Impact is.

No tool counts the customers about to be hit.

→ Rank by customers affected
Insight 03Same incident, different eyes.

Agent ≠ engineer ≠ zone lead ≠ supervisor.

→ One incident, role-aware lenses
Insight 04Support doesn’t end when the fix starts.

Calls continue until service truly stabilises.

→ Live recovery before closing
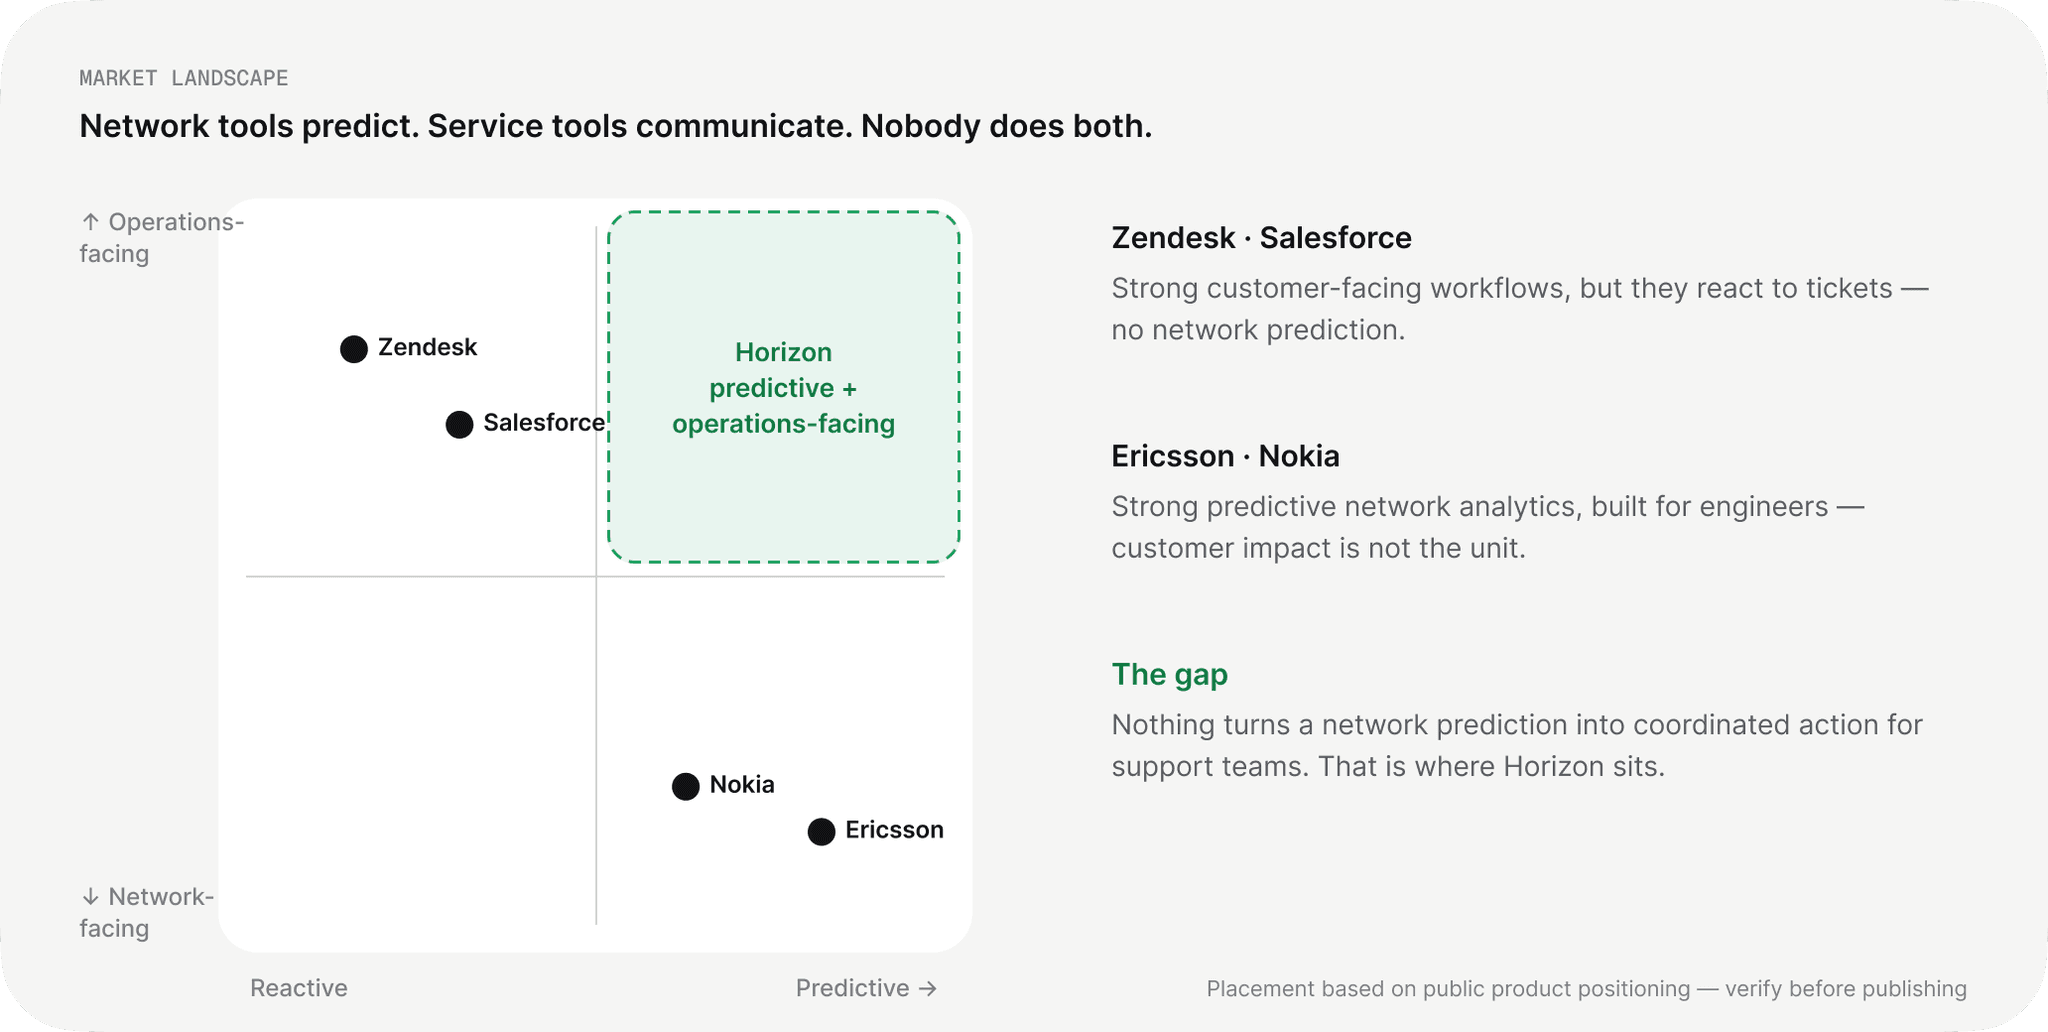
Market landscape: network tools predict, service tools communicate, nobody does both
Competitor analysis

Each tool covers half the job.

ToolWhat they offerGapsDesign opportunity
EricssonNetwork analyticsPredictive monitoring · AI anomaly detection · strong 5G insightsToo technical and engineer-focused · no customer-impact view · no simple explanationsPlain language · agent-friendly UI · customer impact at a glance · one-click actions
Nokia CareDevice careReal-time diagnostics · device-level insights · automated troubleshootingComplex UI · limited prediction · device-focused onlyClear alerts · area-level predictions · simple workflows
ZendeskCustomer serviceTicketing · automation · chat workflowsNo network insights · no prediction · issues reported by handNetwork + customer data together · auto-detected issues · predictive alerts
Salesforce Service CloudCustomer serviceCustomer 360 data · case management · automation and AI suggestionsNot telecom-native · no outage prediction · heavy customisationTelecom-ready · early warning system · simple, lightweight UI
Horizon’s differentiator

Predicts issues early and explains them in plain language, so support teams act before customers complain.

  • Explainable AI: “why this is happening”
  • Ranked by customers affected
  • Agent workflows + supervisor triage
  • One-click customer SMS
  • Every team in one tool
03Who it’s for

Four roles, one incident, and no shared picture.

RSRiyaSupport agentIs this caller part of a bigger outage?Needs

Status + a script for the caller’s area

IKIrfanZone lead · main userWhich tower, how bad, who’s free?Needs

Warnings ranked by customer impact

ASAhmedField engineerWhat’s wrong, and where exactly?Needs

A brief with evidence and site details

APAnitaSupervisorIs anything about to blow up?Needs

Cross-zone view + proof predictions work

Proto-personas from desk research and role mapping.

Persona detail

Three roles in detail: what each one needs from Horizon.

RS
RiyaSupport agent · 27

Frontline agent who needs quick, clear answers to cut repeat calls.

Responsibilities
Handle daily complaints · troubleshoot network and billing · file tickets · update customers · escalate
Pain points
Too many tools · no real-time sector status · repeat calls for the same outage · no early alerts
Needs
One sector console · simple AI root cause · quick customer notifications · fast actions (SMS, ticket, affected list)
Goals
Faster resolutions · fewer calls · clear customer communication
IK
IrfanZone lead · 34 · main user

Field coordinator who needs early tower warnings to prevent outages.

Responsibilities
Monitor tower health · dispatch field engineers · coordinate repairs · track repeat failures
Pain points
Scattered data sources · no impact count per zone · no early tower warnings · slow manual prioritising
Needs
Zone-level dashboard · predictive tower alerts · built-in engineer assignment · high-impact zone list
Goals
Less downtime · a more stable zone · fix issues before escalation
AP
AnitaSupervisor · 42 · escalation manager

Operations leader who needs to see escalations coming.

Responsibilities
Oversee sectors and teams · maintain SLAs · review performance · lead during outages
Pain points
No real-time analytics · hard to tell regional from local issues · late escalations · no prediction history
Needs
AI prediction dashboard · complaint surge alerts · clear action suggestions · team and issue breakdowns
Goals
Prevent major escalations · reliable service · fast, informed decisions
Journey map · Irfan, zone lead · one outage

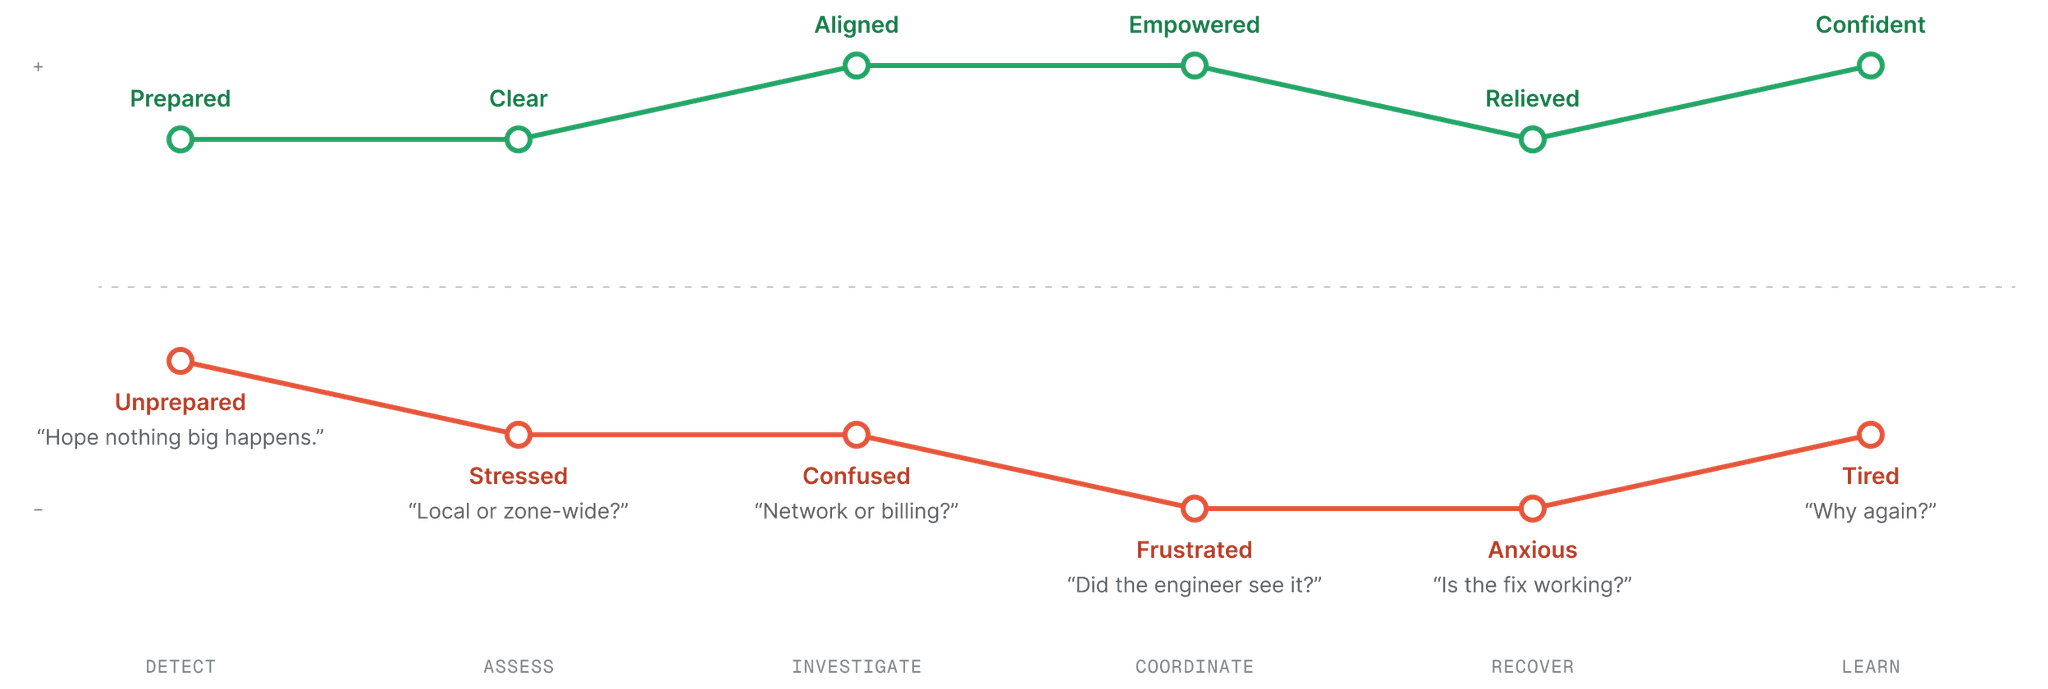
Same outage, two experiences

TodayWith Horizon
Emotion curves for today and with Horizon across six stages of one outage
Emotions mapped from role research (hypothesised). The gap between the curves is what Horizon is designed to close.
Journey detail

Irfan’s outage, stage by stage: today vs with Horizon.

Stage01Detect02Assess03Investigate04Coordinate05Recover06Learn
TodayWhat happensNothing yet: the issue is hidden; teams wait for complaintsAgents take a flood of calls; Irfan checks scattered dashboardsAgents switch tools; Irfan checks tower KPIs by handAgents raise tickets; Irfan phones engineersEngineers troubleshoot; agents keep customers informedTickets closed; patterns missed
TodayPain pointsNo early warning; blind to tower healthNo sector view; no count of customers affectedScattered data; slow diagnosisDuplicate effort; no shared issue statusNo live feedback; agents still get callsNo root-cause learning; outages repeat
With HorizonWhat happensA predicted issue arrives before any callIssue card shows cause + customers affectedAssign an engineer and brief agents in one placeOne-click fix, bulk SMS, ticket raised instantlyWatch recovery and the drop in complaintsClose, give the AI feedback, review patterns
FeelingToday → HorizonUnprepared → PreparedStressed → ClearConfused → AlignedFrustrated → EmpoweredAnxious → RelievedTired → Confident

The detail behind the journey curve above.

Revised problem statement

Four support roles need one shared, explainable view of emerging network issues, ranked by customer impact, so they can coordinate a fix before customers are affected.

04Key decisions

What I chose to show, and what I left out.

Three principles guided every call: explainable, impact-first, coordinated. The AI only suggests; a person always approves.

Scoping · Decision 00

The problem space covered outages, usage anomalies and billing. I designed network outages end to end first because one outage triggers the most simultaneous calls. Usage anomalies show up at customer level (moment 05); billing is phase 2.

Decision 01

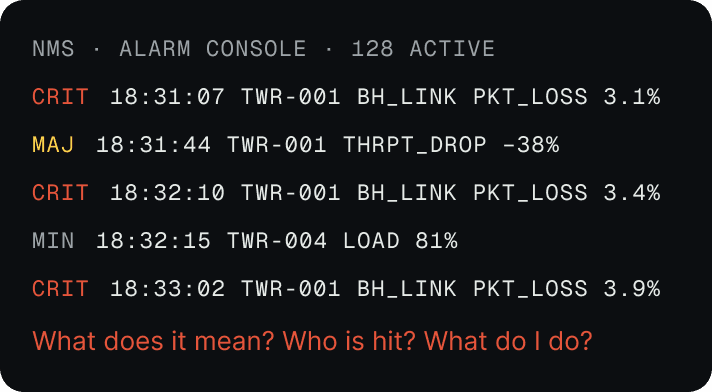
From alerts to actionable issue cards

Instead of
A raw anomaly feed
I chose
Cause + confidence + customers at risk + one next action, on one card
Because
It answers “so what do I do?” without leaving the card.
BeforeRaw alarm feedRaw alarm feed with five alarm lines
→
AfterOne issue cardOne issue cardCause · confidence · 2,847 customers · next action

5 alarms about one tower become one card that says what is happening, who is affected and what to do.
Decision 02

Customers affected is the headline number

Instead of
Rank by technical severity
I chose
A big customer count; severity becomes a badge
Because
It is the one number every role reads the same way.
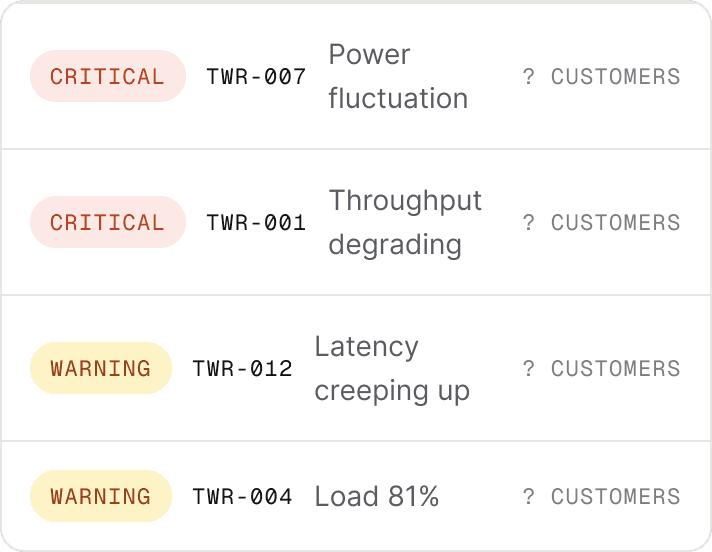
BeforeSorted by severityIssues sorted by severityTwo “criticals” look equal: which one first?
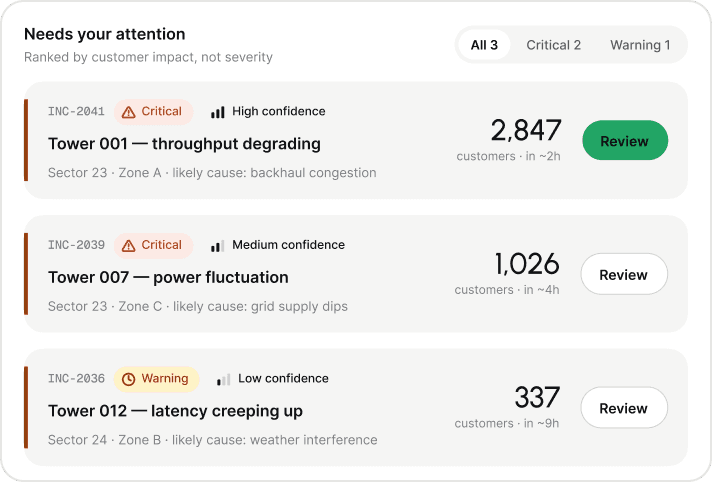
→
AfterRanked by customers hitIssues ranked by customers affected2,847 → 1,026 → 337: the order is the decision
Severity stays as a badge; the customer count becomes the headline that every role reads the same way.

Decision 03

One incident, role-aware lenses

Instead of
Four dashboards, or one identical view
I chose
One shared incident; each role sees a different density
Because
Shared truth keeps everyone aligned without drowning the agent.
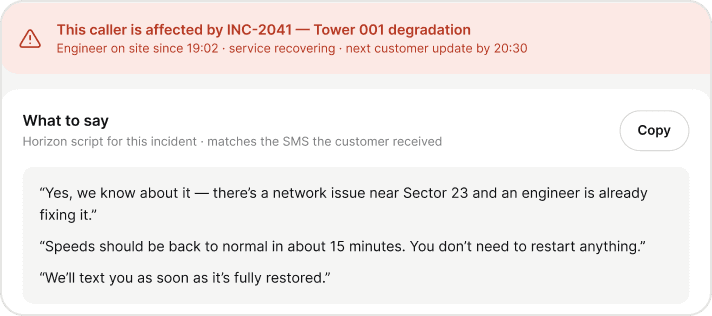
AgentRiya · on a callAgent viewIs this caller affected? What do I say?
=
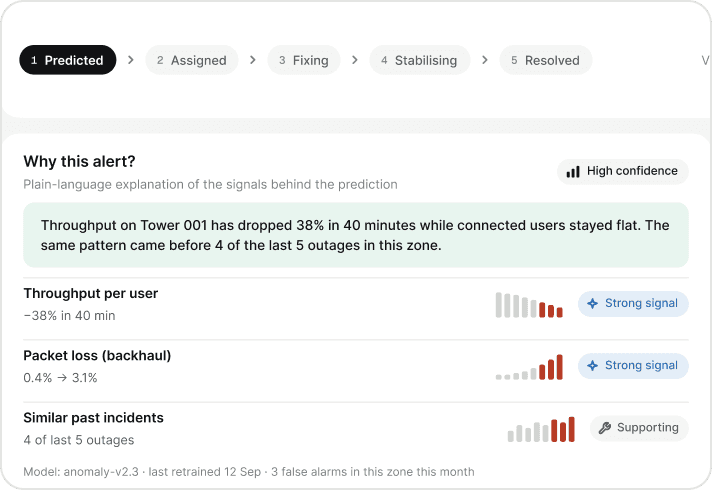
Zone leadIrfan · fixing itZone lead viewWhy did it fire? How confident? Who is affected?
Both views read from INC-2041, one source of truth. Only the density and the first question change.

Decision 04

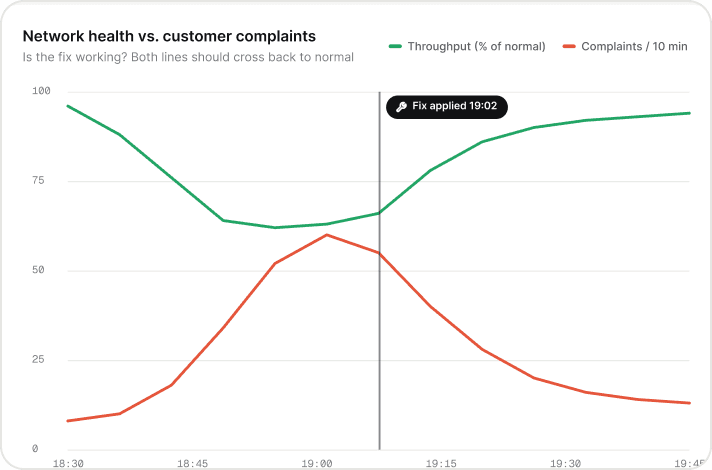
“Resolved” is not the end

Instead of
Close the ticket when the fix is applied
I chose
Live recovery monitoring until calls actually drop
Because
Agents give callers a true answer, and the model learns from real outcomes.
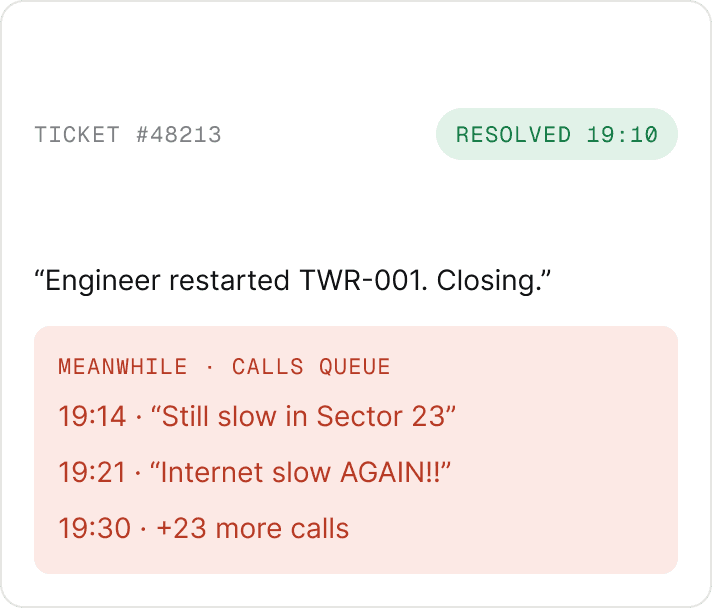
BeforeClosed when fixedTicket closed when fixedThe ticket says fixed; customers say otherwise.
→
AfterOpen until calls dropIncident kept open until calls dropHealth up, complaints down, then close
Close is only offered once recovery is confirmed, and what was predicted vs. what happened feeds back to the model.

Process

How it came together

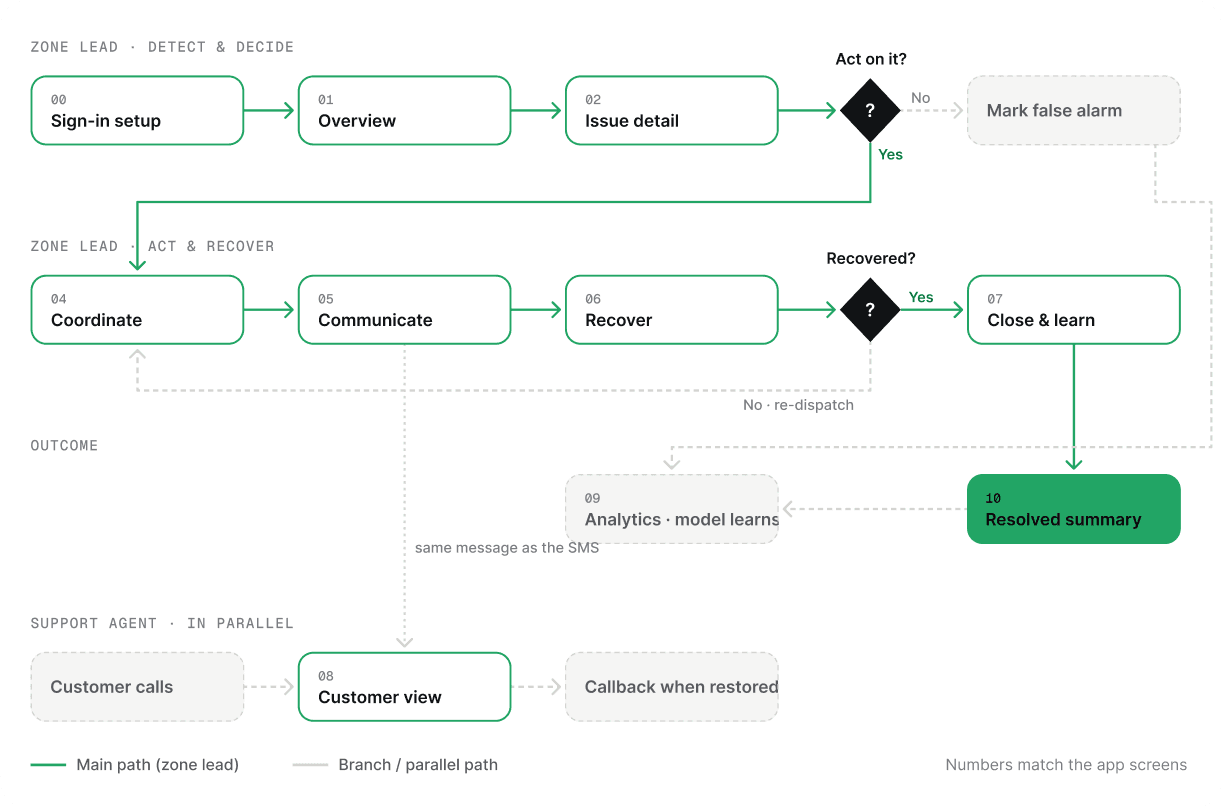
User flow with the scenario path highlighted
User flow · the scenario path is highlighted
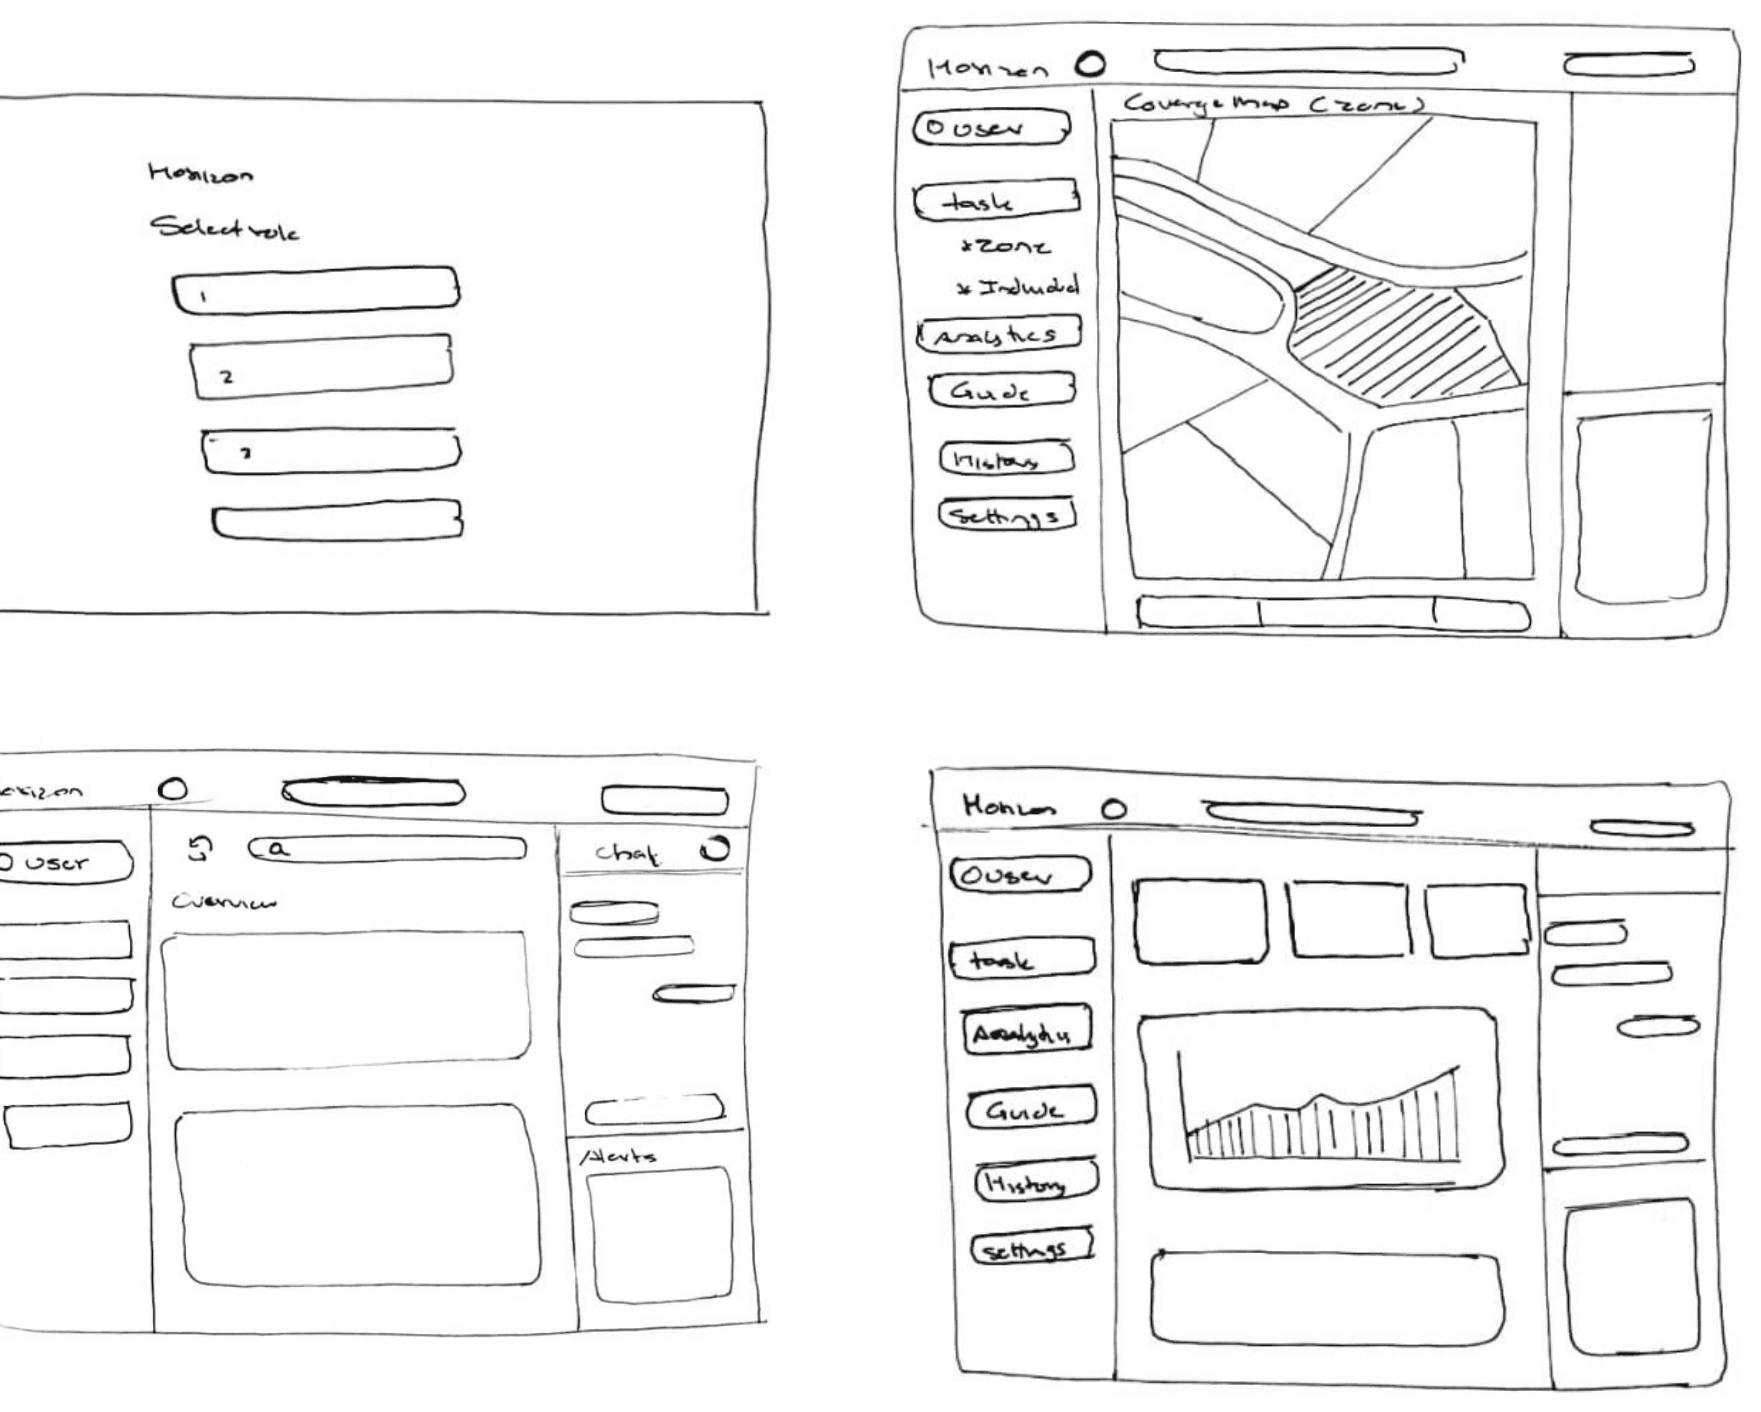
Lo-fi wireframes
Lo-fi wireframes · tested before any visuals
Interaction flow

One issue, handed across every role.

Horizon AISuggests only
SupervisorAnita
Zone lead / engineerIrfan · Ahmed
Support agentRiya
EveryoneShared incident
Detects a risk

Network anomaly, usage spike or billing issue

Writes the card

Cause, customers affected, confidence, next step

Triages

Assign, notify agents, notify customers or approve a fix

Fixes the tower

Reset, traffic shift or dispatch; updates status

Answers callers

Sees if the caller is affected; ready script; SMS

One shared issue

Timeline, comments and live recovery in one place

Closes + learns

Resolved, closed, and Horizon learns from the outcome

A person approves every action; the AI only suggests. The dashed line feeds the next prediction.

05The product

One incident, from first signal to confirmed recovery.

Follow Irfan, a zone lead, through Tower 001, starting 2h 14m before anyone calls.

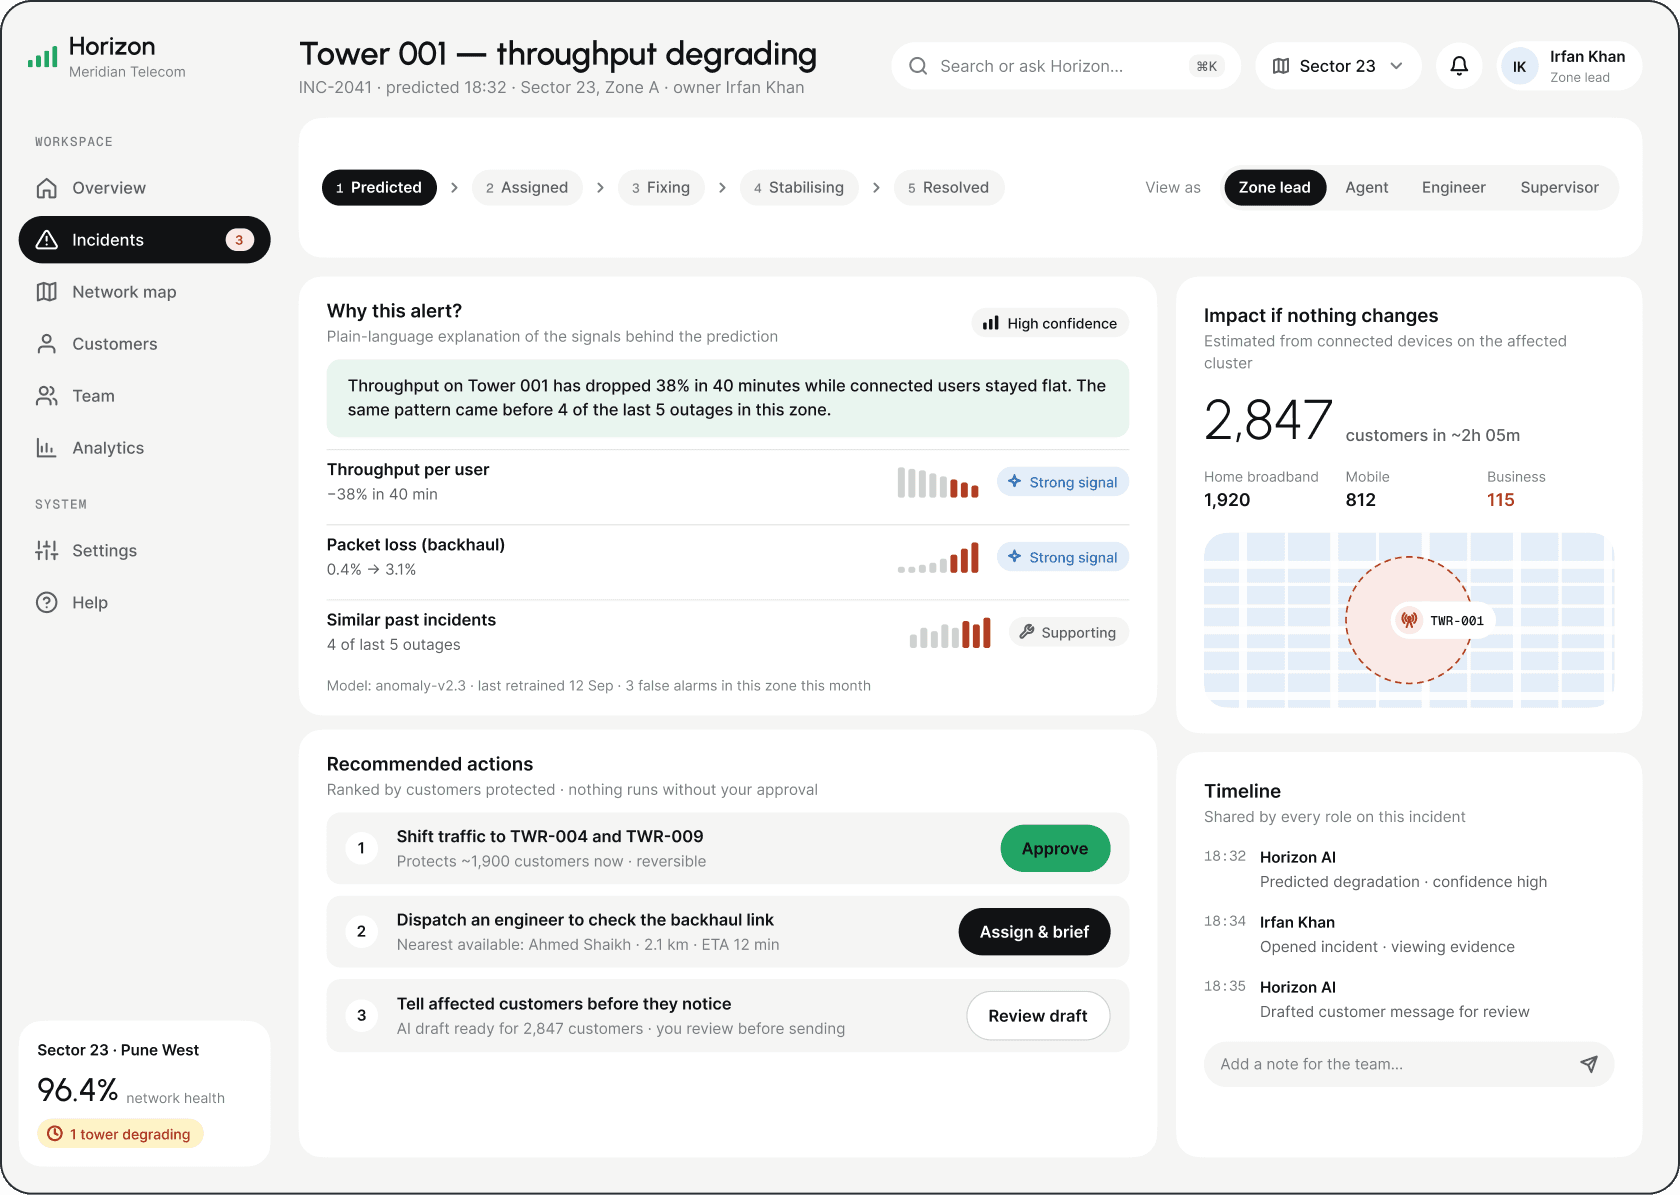
Tower 001 issue detail screen
01

Detect & understand

A prediction arrives as an issue card: cause, confidence and customers at risk, in plain language.

  • Cause written for non-engineers; evidence one click away
  • Confidence is always shown, never hidden
Solves Insight 01 · prediction → next step
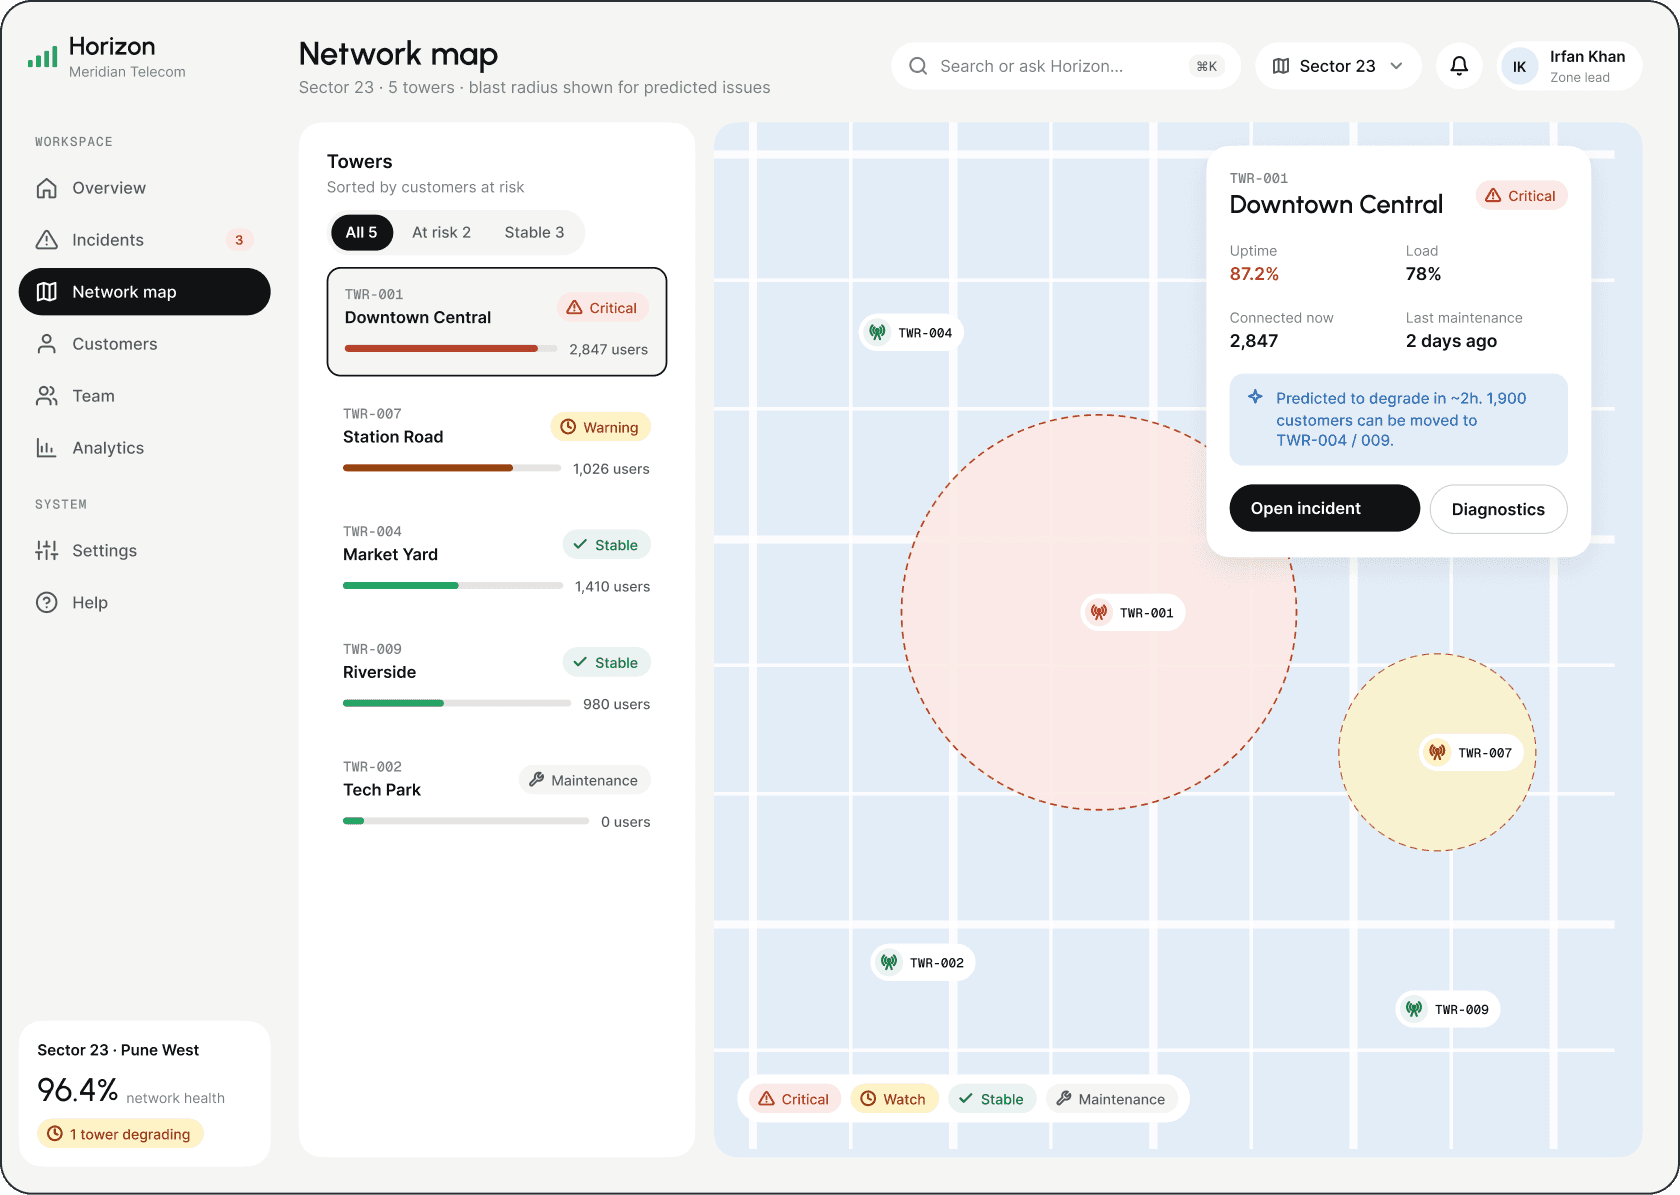
Network map screen ranked by impact
02

Prioritise by impact

Issues are ranked by customers affected, and the map shows the blast radius.

  • 2,847 customers is the headline; severity is a badge
  • Nearby towers and free engineers in one view
Solves Insight 02 · impact, not severity
Coordination screen with shared timeline
03

Coordinate in one place

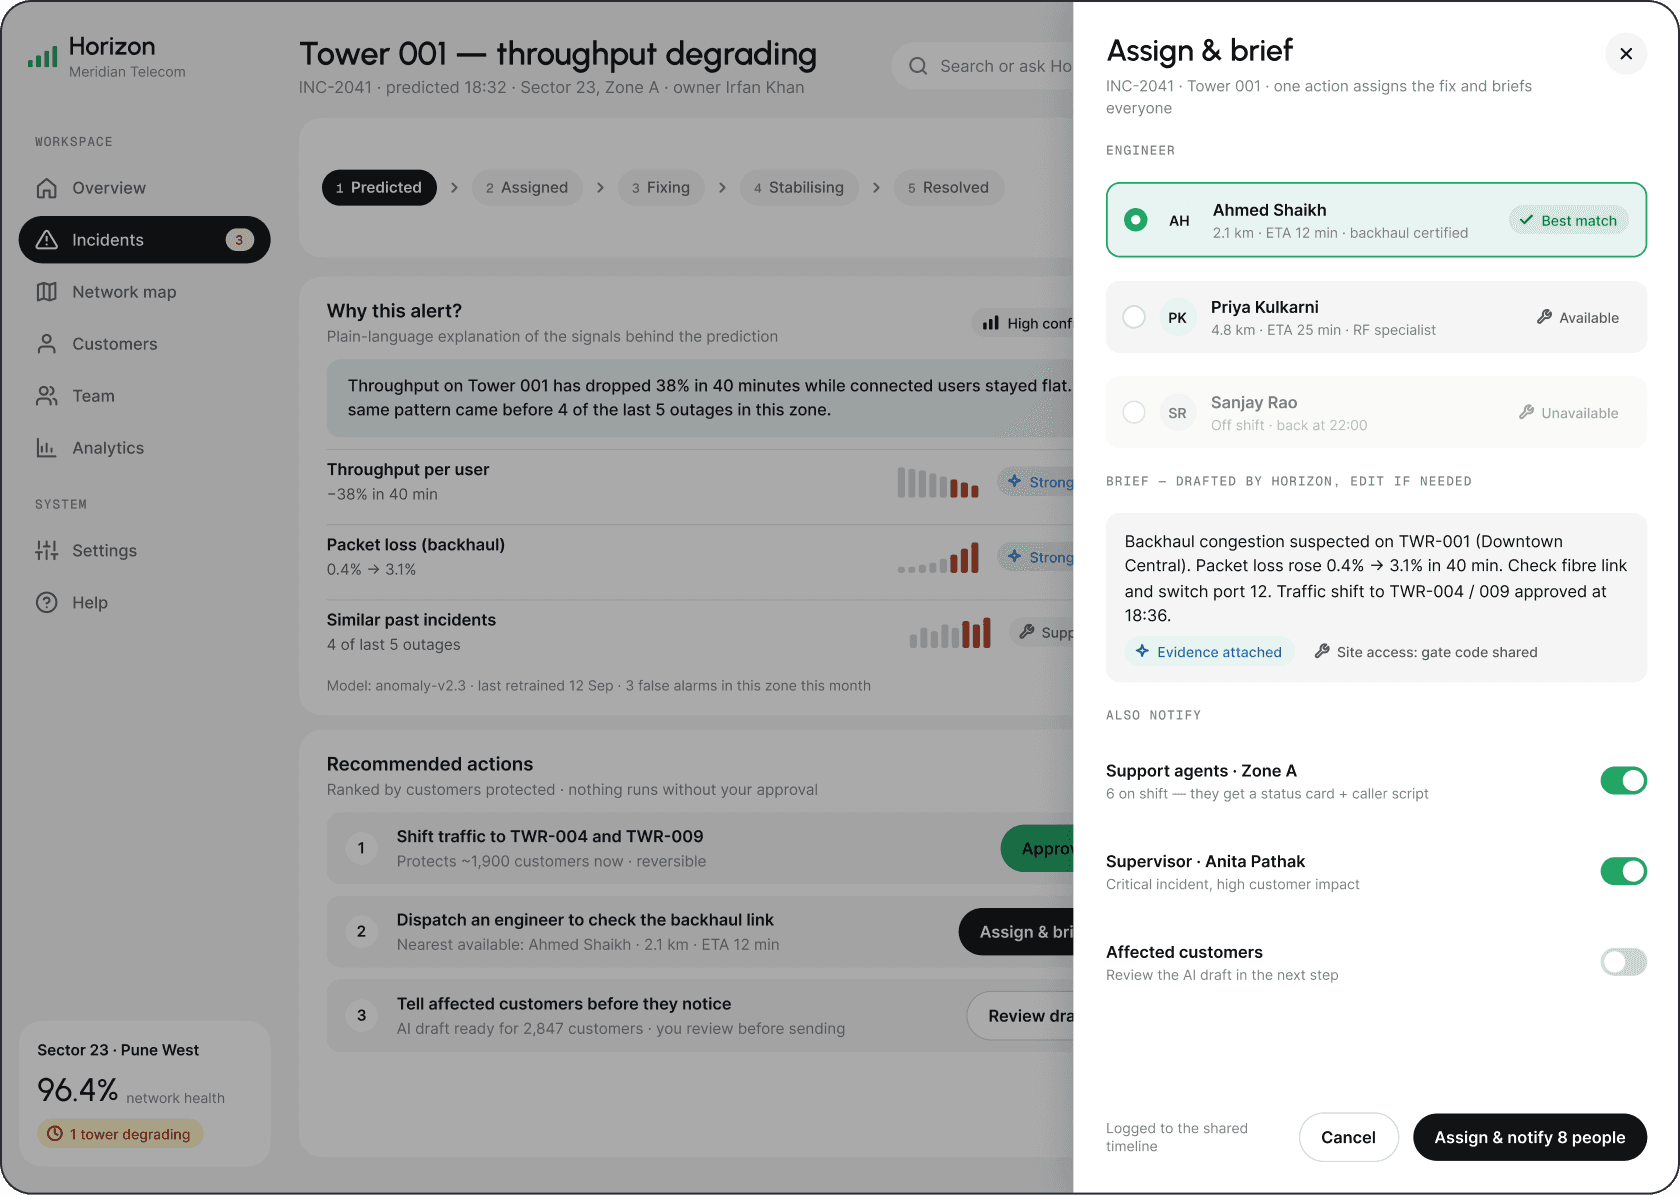
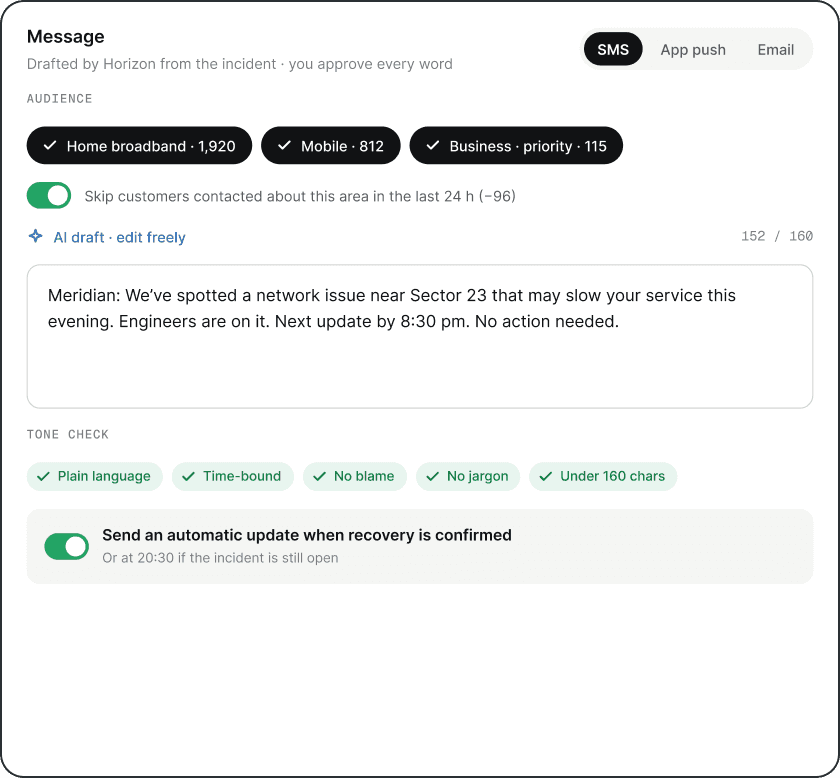
Assign an engineer, brief agents and message customers from the issue itself.

  • Every action auto-logs to one shared timeline
  • Agents get a ready script for callers in the zone
Solves Insight 03 · one incident, every role
Live recovery screen
04

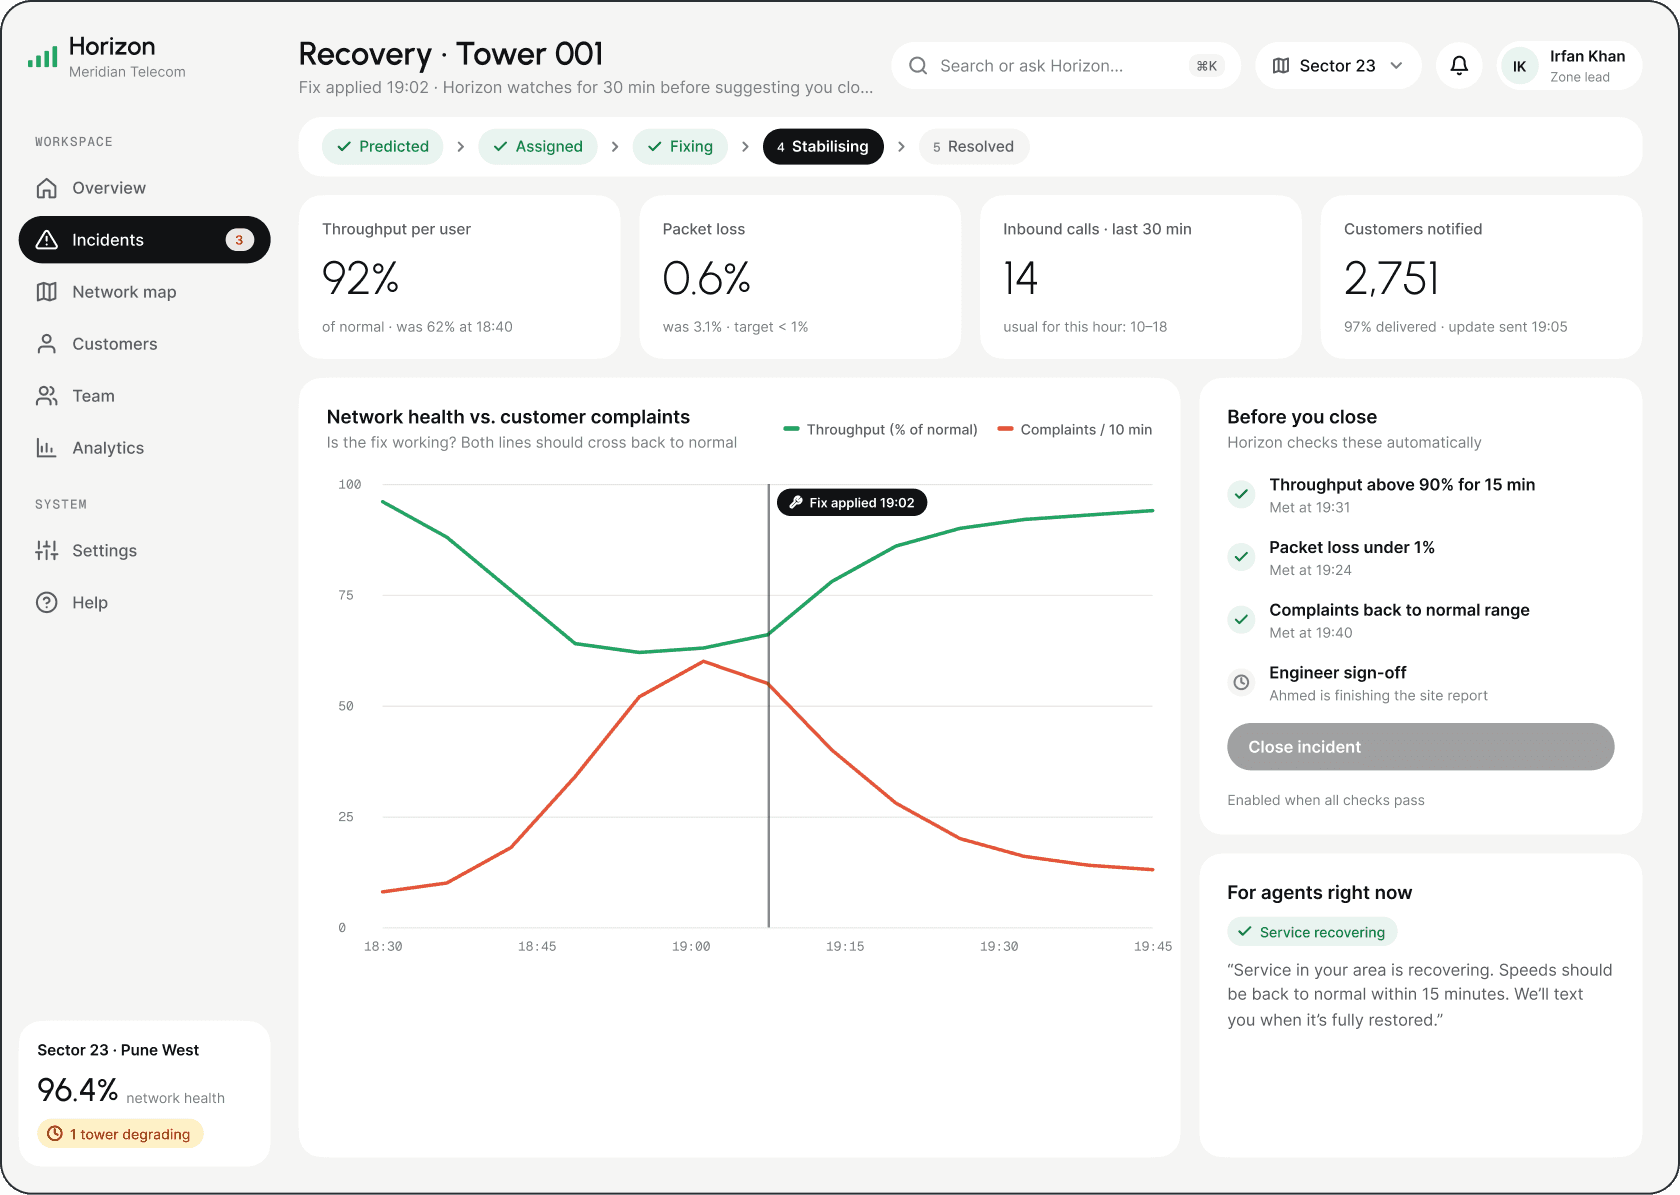
Recover, then close

The incident stays open until complaints actually fall, then Horizon logs what it predicted vs. what happened.

  • Live recovery: throughput, calls, customers restored
  • Close & learn feeds accuracy back to the model
Solves Insight 04 · proof the fix worked
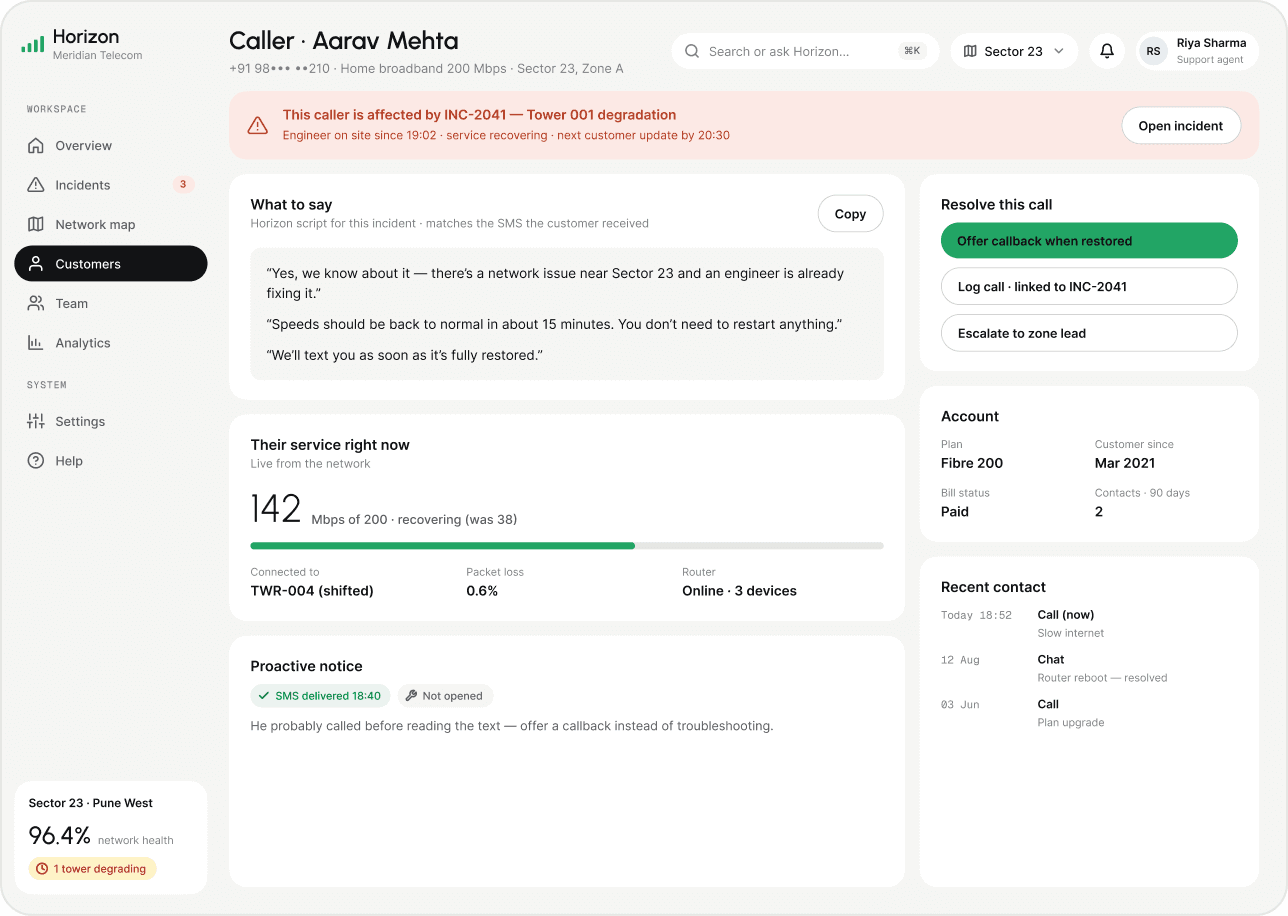
Customer-level view for an agent
05

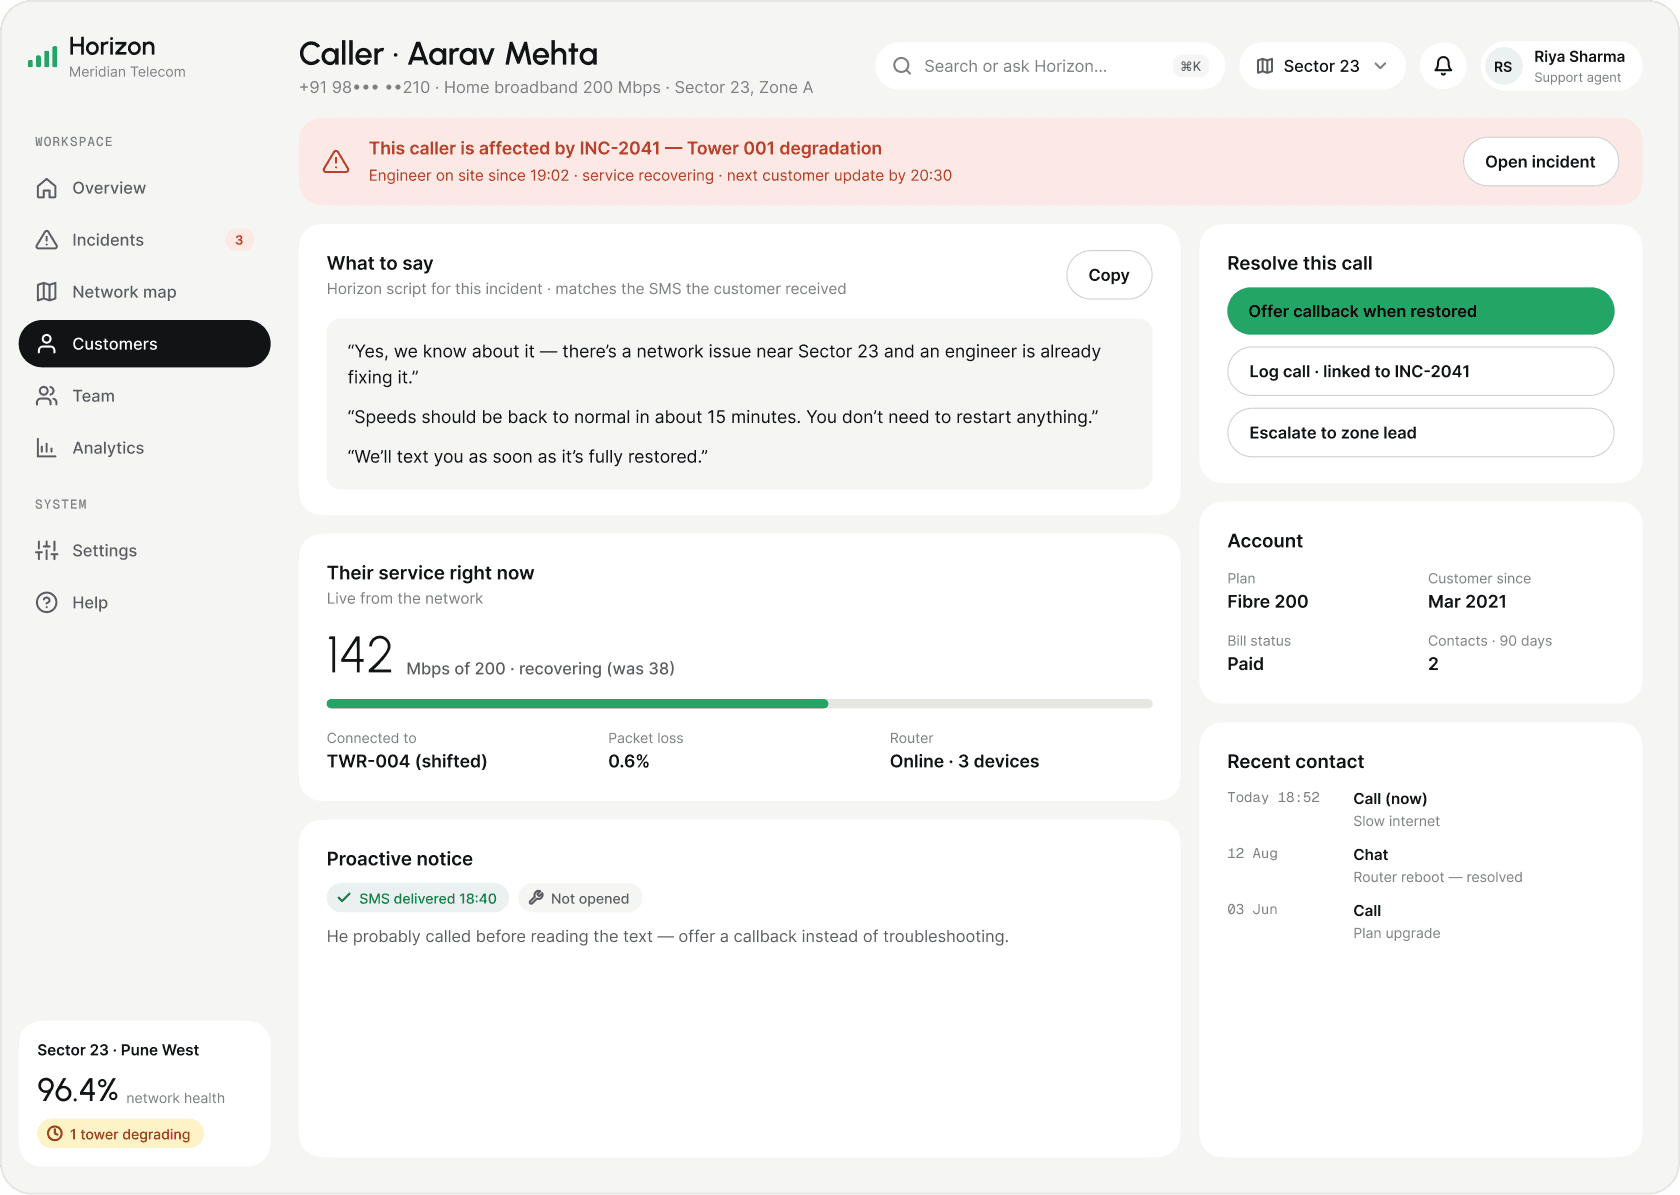
Zoom into one customer

The same prediction works at customer level: an agent sees if this caller is part of the outage, or has their own usage anomaly.

  • Zone-level outage and personal alerts in one view
  • A ready answer and script before the agent speaks
Solves zone + individual level
Every other role

The same incident, through every other role

Riya, the agent, is covered in moment 05. Here is what the engineer, the customer and the supervisor see of INC-2041.

AS
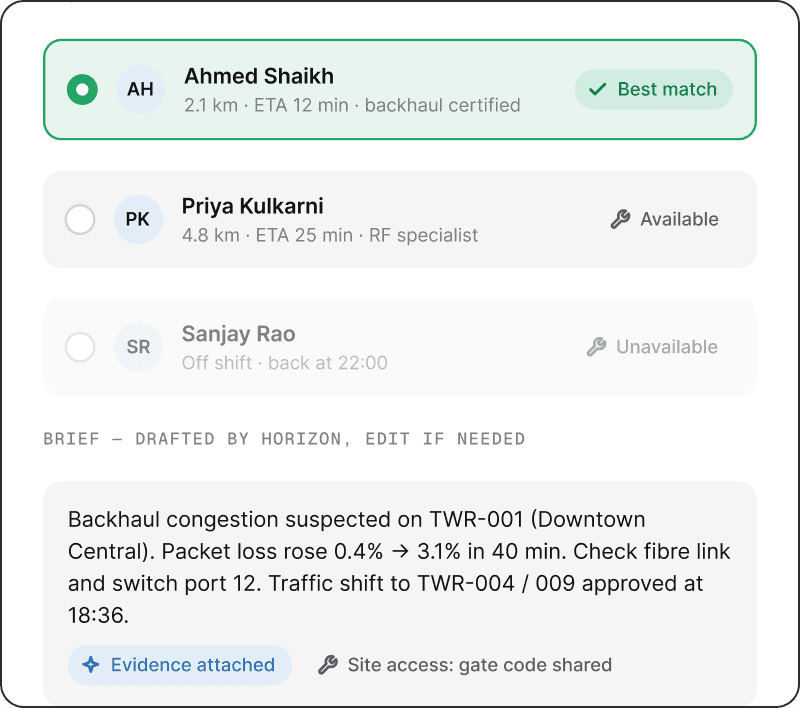
AhmedField engineer · screen 04
“What’s wrong, and where exactly?”

He gets a brief with the likely cause, evidence and site, not a vague “slow internet” ticket.

Field engineer brief
C
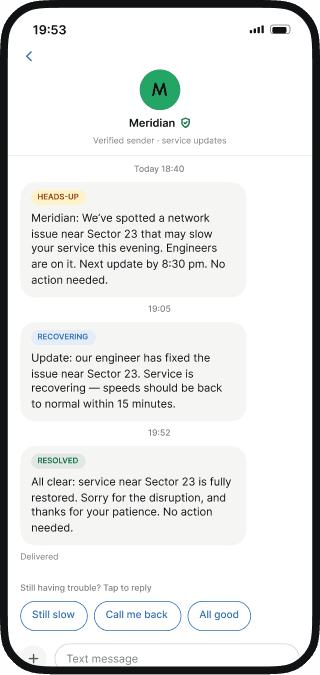
Customers in Sector 23Affected customers · screens 05 → 11
“Is anyone going to tell me?”

The message the zone lead approves becomes an SMS before anyone calls: one source, no mixed messages.

Approved customer messageSMS on a customer’s phone
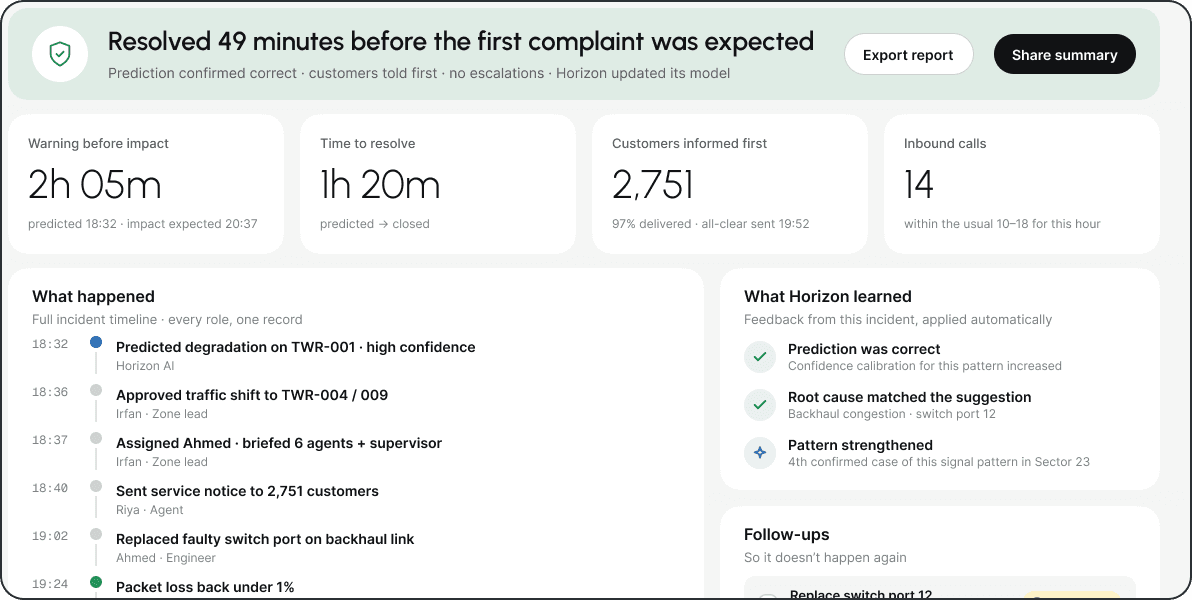
AP
AnitaSupervisor · screen 10
“What happened, and did the prediction work?”

A shared summary: resolved before the first complaint, with what was predicted vs. what actually happened.

Incident summary
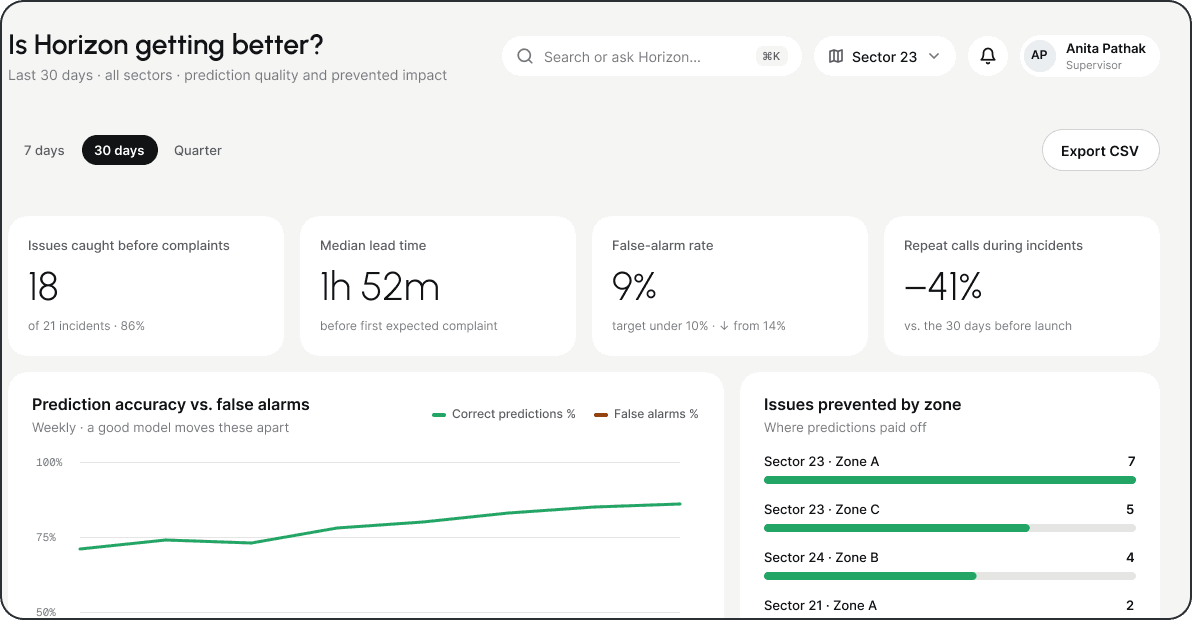
AP
AnitaSupervisor · screen 09
“Is Horizon getting better over time?”

Across incidents: prediction accuracy, lead time and false alarms, the proof the model can be trusted.

Prediction accuracy over time
Visual system

Calm by default, colour only when it means something.

Type

UrbanistHeadlines & the one number that matters

Inter, readable at console density

GEIST MONO · IDS, TIMES, DATA

Status colour · always paired with an icon + label
Critical

Act now · customers at risk

Warning

Watch · trending worse

Stable / resolved

Confirmed, not assumed

AI / info

A suggestion, never an action

06Iteration

My first version looked finished. It answered the wrong question.

v1 showed everything the AI knew. Critiquing it against my own insights, I rebuilt it around what each role needs to do next.

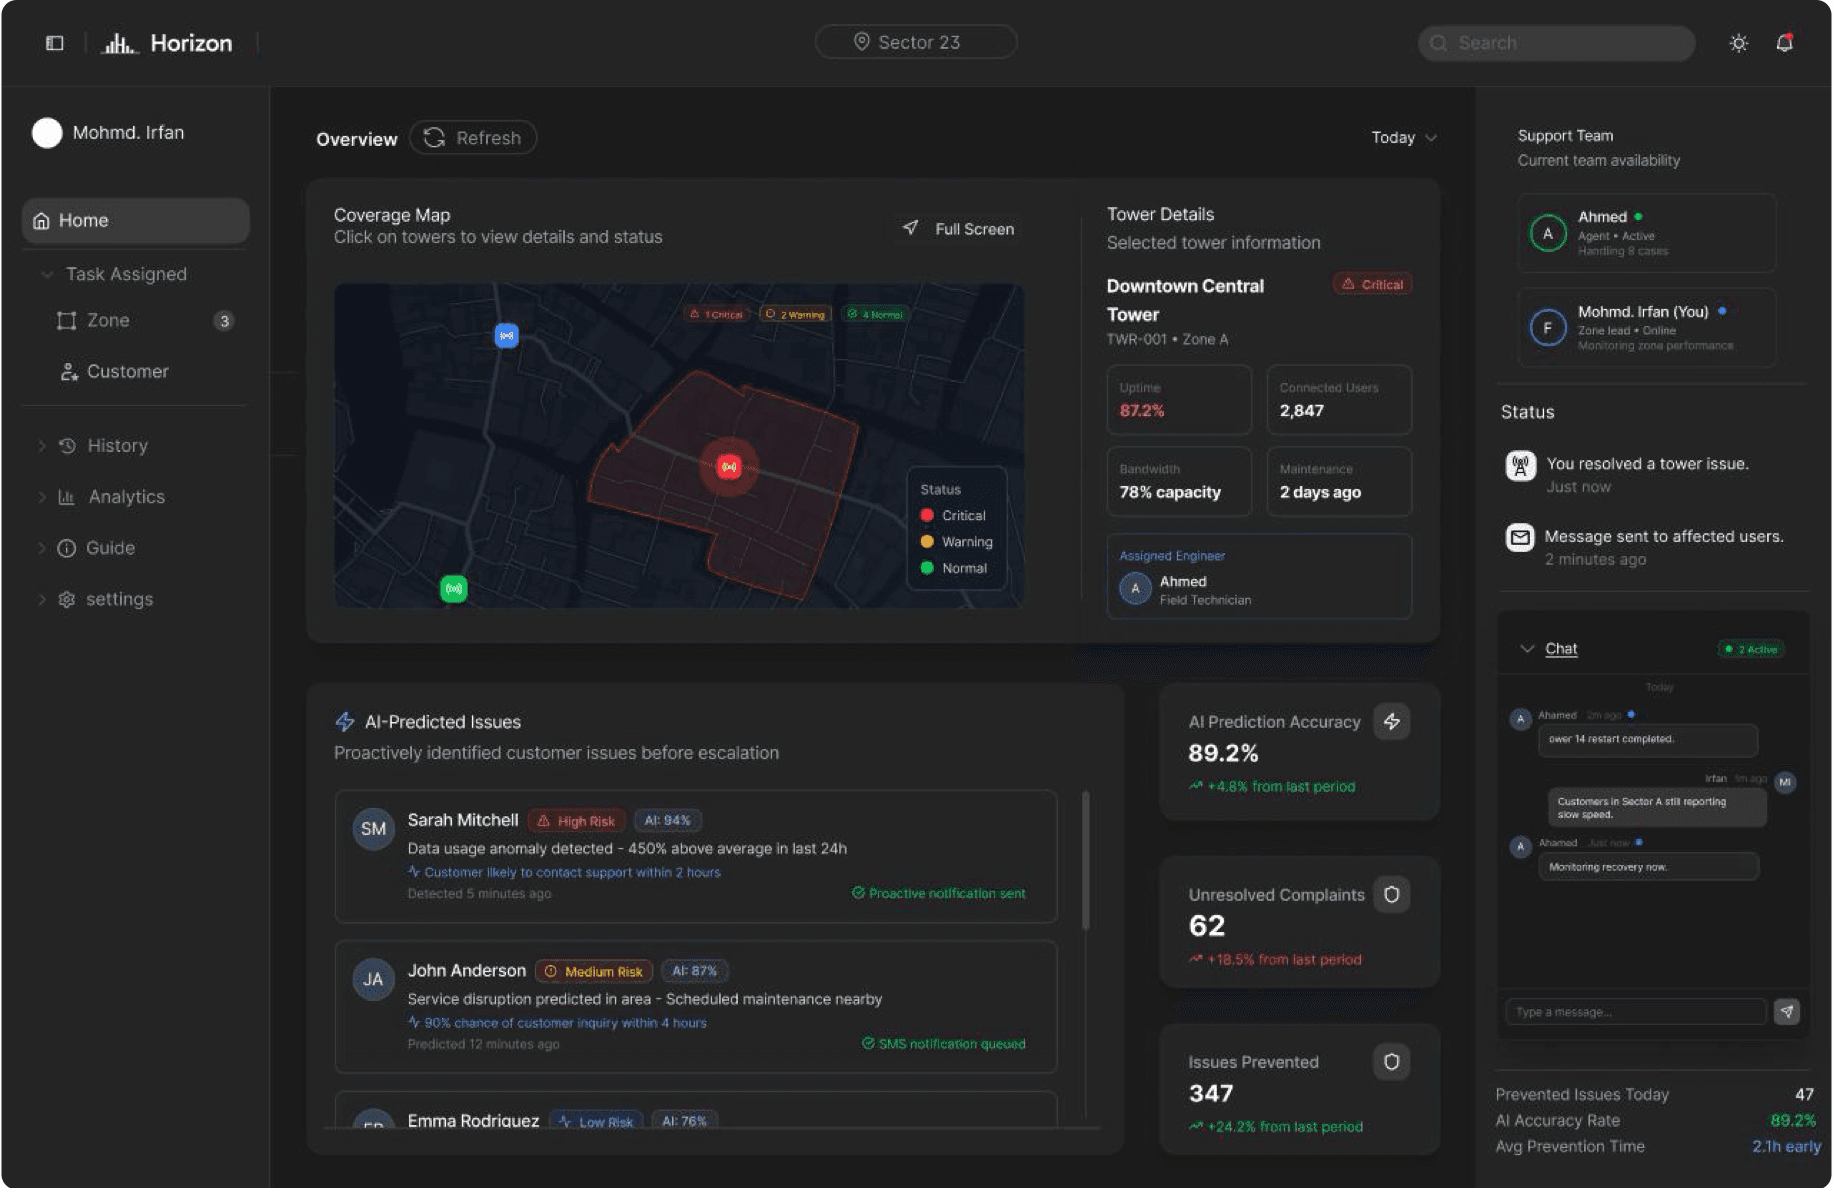
Overview: from “everything” to “what next”

V1 · first versionVersion 1 overview
V2 · redesignVersion 2 overview
In v1In v2Why
Issues listed per customer (Sarah, John…) with an AI risk %Issues listed per tower, ranked by customers affectedOutages hit clusters: 47 callers are one issue, not 47
One global “AI accuracy 89.2%” tileCause + confidence on every issue cardTrust comes from explaining each alert, not a model score
Map, chat, status and team in separate panelsOne incident with an auto-logged shared timelineCoordination was where time was lost

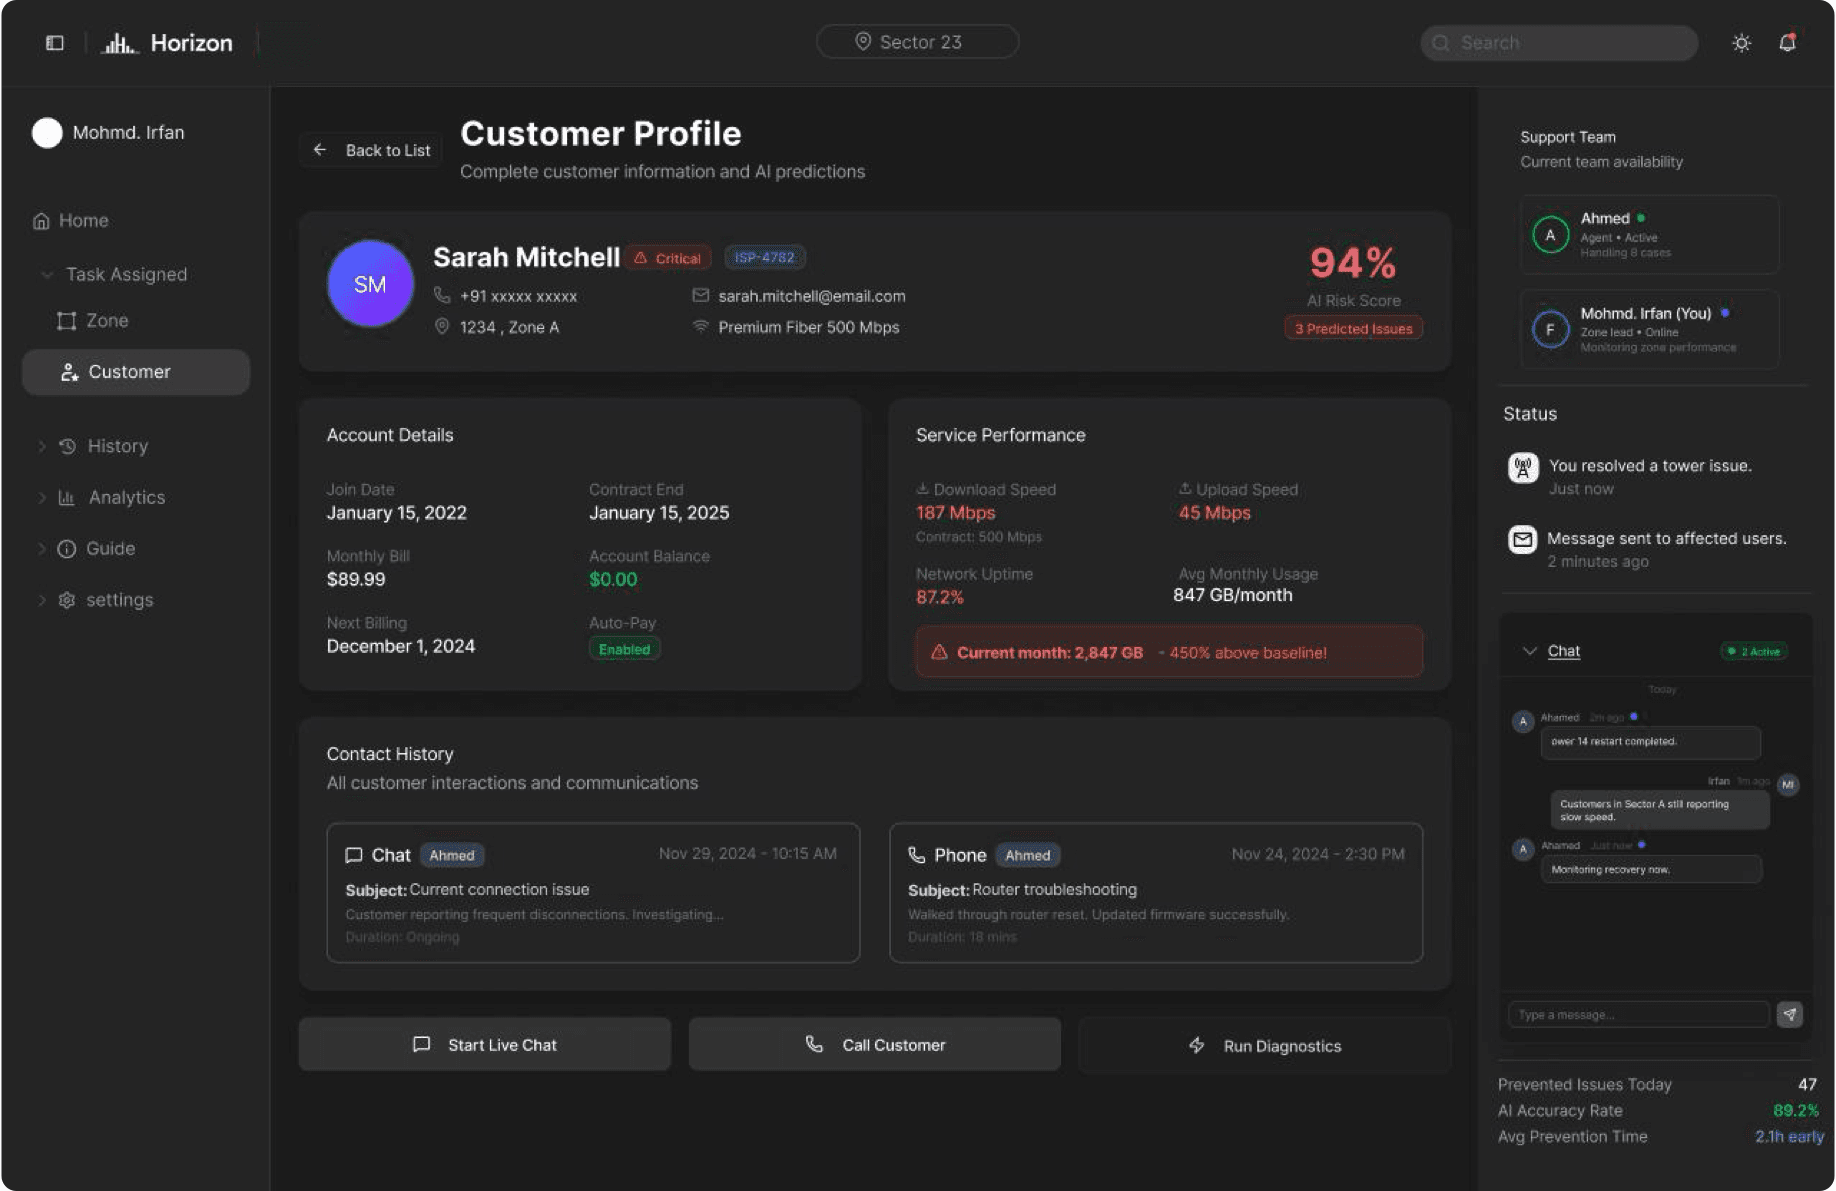
Customer view: from 360° profile to the caller’s question

V1 · first versionVersion 1 customer view
V2 · redesignVersion 2 customer view
In v1In v2Why
Full account, billing and contract details first“Is this caller part of the outage?” answered at the topIt is the agent’s first question on every call
Generic actions: chat, call, run diagnosticsA ready script + outage ETA for the callerAgents need a true answer, fast
Next: validate v2 →
  • 5-person think-aloud with support staff
  • Task: triage 3 predicted issues
  • Measure: time to right action + trust rating
07Impact & reflection

Designing AI for operations is deciding when to act.

How I’d measure success · targets from the scenario, not test results
2h+Lead timeAct before the first complaint

Time between Horizon’s first warning and the first customer call.

−70%Triage timeFrom signal to assigned engineer

Root cause is found by hand across tools today (30+ min). Target: under 10 min once cause, impact and best-match engineer arrive on one card.

−40%Repeat callsCustomers told before they call

Calls about an outage that is already known. Proactive SMS and a ready agent script should cut them by ~40%.

What I learned
01Systems over screens

The problem lived in the handoffs between four roles, so I mapped them before drawing a single screen.

02Explainability is UX

An AI alert is only useful if a non-engineer can say why it fired and what to do next.

03Less, earlier

Every decision removed something. The best version shows one number, at the right moment.

“The strongest interface isn’t the one that shows the most. It’s the one that helps a team make the next decision.”